|
INTRODUCTION :
In the conversations on 'climate change' and 'global warming',
the reporting often talks about
'increased carbon dioxide' (CO2)
and
'increased greenhouse gases' (GHG)
rather than the more directly experienced ('less removed') factors
'increased heat generation'
and
'accelerating temperature rise'.
I have pointed out, on another page of this web site, on
climate change, atmospheric gases, and fossil fuel heat generation
that the modeling of the SOURCES AND CAUSES OF ATMOSPHERIC
TEMPERATURE RISE ARE VERY COMPLEX AND INVOLVE MUCH MORE THAN
infrared radiation and capture of that radiation by carbon dioxide
--- which is consitutes only
4 HUNDREDTHS OF ONE PERCENT of Earth's atmosphere.
In short, there are other factors (other than carbon dioxide) that
may be contributing significantly to atmospheric temperature rise.
Nitrogen molecules (N2) and oxygen molecules (O2) constitute
99 PERCENT OF THE ATMOSPHERE (about 78% N2 and 21% O2).
The 'science', that is often referred to, was an isolated
experiment in a laboratory setting (in the mid-1800's by
an English physicist,
John Tyndall) --- comparing
infrared radiation absorption by various gases ---
such as CO2 and N2 and O2.
He showed that a flask of CO2 absorbs much more
infrared radiation than N2 or O2.
However, note that because N2 and O2 make up about 99%
of the atmosphere and CO2 makes up about 0.04%,
there is about 99/0.04 = 2,475 times more N2 and O2 in
the atmosphere than CO2.
Statements about causes of atmospheric temperature
rise typically ignore the infrared absorption
of N2 and O2. That implies that the people making these
statements believe that N2 and O2 absorb on the order
of 1% (or less) as much radiation as CO2.
Put that factor of 100 difference together with
the fact that N2 plus O2 are more than 2,475
times as plentiful as CO2, and we find that such
statements (and the people who make those statements)
imply that the infrared absorption of N2 and O2
should be about 247,500 times less than CO2.
Is that the case? Does CO2 dominate (by that much)
N2 and O2 in the absorption of infrared radiation?
I have done a lot of web searches for documents
that might compare the infrared absorption of
CO2 to N2 and O2. No luck. The absorption data
for N2 and O2 seems to be very hard to find.
Perhaps you will have better luck with WEB
SEARCHES on keywords such as
carbon dioxide nitrogen oxygen infrared absorption
I suspect that infrared radiation absorption by
N2 and O2 is not that 'negligible'.
If the infrared absorption by N2 and O2 is not negligible, then
there is EVEN MORE trapping of energy by atmospheric gases.
But let us put that infrared radiation absorption issue
aside for now --- and proceed to consider another possible
source of atmospheric temperature rise --- 'direct heating'
of N2 and O2 molecules.
That is, let us consider the increase in the average velocities
of the N2 and O2 molecules due to 'direct heating' from heat
sources here on Earth.
The point of this page
I think that there is too much talk about the causes of
'climate change' --- that is, 'atmospheric temperature rise'
--- WITHOUT any consideration of the effect that the burning
of fossil fuels (gas, coal, oil) has 'directly' on the
atmosphere.
In other words, the conversation seems to be focused
only on the amount of heat in the atmosphere due to
'trapped' solar radiation --- with no consideration
of the 'direct effect' of fossil fuel burning on the
temperature of the atmosphere.
By 'direct effect', I mean the heating of the
N2 and O2 (and other) molecules in
'local' air (initially) by direct contact with
'heated items' that result from fossil fuel burning.
These 'heated items' can include
-
hot gases from the burning of gas-coal-oil-biomass
-
hot surfaces such as the engine blocks,
manifolds, and exahust pipes of combustion engines
-
heat from ovens and furnaces, used for
baking, paint curing, metal extraction and
metal melting, ceramic hardening, etc.
-
heat from the heating systems of residential
and commercial buildings
-
and the list could go on.
'Initially' that heated atmosphere is in the locality
of the heat source, but those heated N2 and O2
molecules rapidly share their increased kinetic energy
(molecule speed-ups) with more remote atmospheric
molecules by
- direct collisions near the localities
and by
- being carried afar by wind currents (both
horizontal and vertical), and then
'sharing' their increased kinetic energy
with 'remote' atmospheric molecules.
I think we can all agree that this 'equilibration' of
the molecular velocities will occur within a matter of
days --- certainly within a few weeks.
In this web page, I WANT TO PRESENT A CALCULATION
OF THE ATMOSPHERIC TEMPERATURE RISE (per year) DUE
TO THE BURNING OF FOSSIL FUELS (at the present rate).
This calculation will involve three basic factors:
-
the
specific heat capacity of air
-
the amount of energy produced/consumed (per year) by humans
by burning fossil fuels on Mother Earth
-
the mass of air in the Earth's atmospheric shell.
This calculation will yield a rough, 'ball park' estimate.
Let us consider those 3 factors in more detail.
The first factor ---
specific heat of air --- is known sufficiently accurately.
We will use 1,012 joules per kilogram per degree Centigrade.
(This figure was taken from the 'isobaric mass heat capacity'
column of a
Table of specific heat capacities.)
Note that 'specific heat' is the amount of energy that must be added,
in the form of heat, to one unit of mass of the substance (air in this case)
in order to cause an increase of one unit in its temperature.
So 'specific heat' involves three units of measure --- for
- heat (energy),
- mass, and
- temperature.
And 'specific heat' is heat-added, divided by a unit-of-mass, further
divided by a unit of temperature.
Typical units of measure are
- joules for heat energy
- kilograms for mass
- degree-Kelvin (or, equivalently, degree-Centigrade) for temperature
So a value for 'specific heat' of a material is typically
joules per kilogram per degree-Centigrade --- which can be
more briefly written as joules/kg-degC.
The second factor above --- annual fossil fuel heat generation or
consumption by humans --- is known pretty accurately. It has been reported
in many financial publications over the past several decades.
It has been reported for individual fossil fuels (gas, oil, coal)
--- AND as a total.
The energy per year (in
joules per year) generated from fossil fuel sources is about
5.6 x 10^20 joules/year
(around 2015) as reported in an article titled
'How much fuel does it take to power the world?'
by Ethan Siegal for Forbes magazine.
If you want to put the total-joules together by getting data
for gas and coal and oil separately, and then adding them up,
you could try WEB SEARCHES on keywords like:
energy produced by gas coal oil worldwide joules
to accumulate the necessary data.
If you find
energy data in other energy units (such as BTU's, calories,
kilowatt-hours, or other), you could convert to joules.
The third factor above --- the number of kilograms of air affected
by all this fossil fuel burning --- is a little more complicated
to calculate. But it definitely has an upper bound as can
be seen in the image at the top of this page, that shows
the atmosphere of Earth is a thin shell of gas (most of
it within 5 miles of the surface of the Earth).
The height of a significant 'majority' of this gas is
indicated by the fact that if you hike to the top of
the highest mountains (about 5 miles high), you will
need an oxygen mask.
Given that the radius of the Earth is about 4,000 miles,
we see that the height of that
shell of atmospheric gas is only 5/4000 = 0.125 percent
of the radius of the Earth --- about one-tenth of 1 percent.
This is a very thin shell as indicated by the thin black
line (a circle arc) in the following cross-sectional
diagram of Earth --- where the thin line represents
Earth's atmospheric shell.
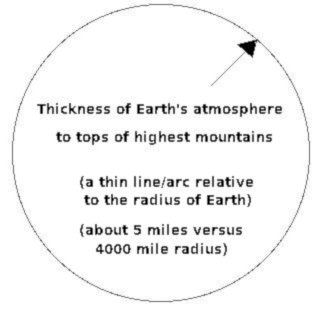
If you put this circle in a screen area of 1000x1000 pixels,
the 8,000 mile diameter of the circle would imply that
each pixel represents 8 miles. So that 5-mile thick shell of air
would be represented by less than a pixel at each point around
the circle.
By using the formula for the volume of a sphere,
we can calculate the volume of that thin shell
of atmosphere --- say in cubic kilometers.
Then by using the average density of the air
in that shell (say, in kilograms per cubic meter),
we can calculate the mass of that atmospheric shell
(in kilograms) --- by using a couple of multiplications.
The calculation of the mass of the atmosphere (in
kilograms) will be presented in an
appendix-section below.
Suffice it to say that the Earth's atmospheric shell
contains about
5.10 x 10^18 kilograms of air
where the symbol '^' represents exponentiation.
Putting the 3 factors together
We can use the 3 factors above to arrive at the
expected atmospheric temperature rise per year ---
in Centigrade per year --- by multiplying the
three factors together, as follows.
Let Sair =
the Specific heat of air.
Let Mair =
the Mass of the shell of air.
Let FFEpY =
the Energy generated per Year
by burning Fossil Fuels
Let ATRpY =
the Atmospheric Temperature Rise per Year
Then we will use the simple division-and-multiplication formula
ATRpY = (1 / Sair) x (1 / Mair) x FFEpY
We can check that the right side gives us the proper
units of measure for the result by noting that the
right side units are
(kg x degC / joules) x (1 / kg) x joules/year
The 'kilograms' and the 'joules' cancel out,
leaving us with degC / year.
The arithmetic
Here is a presentation of the arithmetic.
ATRpY = (1 / 1,012) x (1 / 5.10 x 10^18) x 5.60 x 10^20
The 10-to-the-twentieth divided by 10-to-the-eighteenth
results in a factor of 100.
And 1,012 x 5.10 = 5161.2
So
ATRpY = (5.60 / 5161.2) x 100 = 0.1085 degCentigrade/year
Because of the 'roughness' of these factors, we should
keep only the first couple of 'significant' digits.
So we estimate the 'rate of increase of the atmospheric
temperature per year --- due to burning of fossil fuels'
to be 0.10 of a degree-Centigrade per year
--- which is almost 0.2 degrees Fahrenheit per year.
So in 10 years (~2030), we can expect almost 1.0 degree-Centigrade
atmospheric temperature rise --- which is almost 2 degrees Fahrenheit.
In 20 years (~2040), we can expect about 2.0 degC temperature rise
--- due to burning of fossil fuels --- ON TOP OF any atmospheric
temperature rise due to
'greenhouse gases'.
In 40 years (~2060), we can expect about 4.0 degC temperature rise
--- due to burning of fossil fuels.
Note that these are overestimates because a large amount of
heat energy in the air is transferred into ice, ocean water,
and land masses. (Taking those factors into account would
take more complex mathematical climate models, as discussed below.)
---
The following plot of global temperature change indicates that
the temperature at the surface of planet Earth has been on
an upward trend since (at least) about 1975.
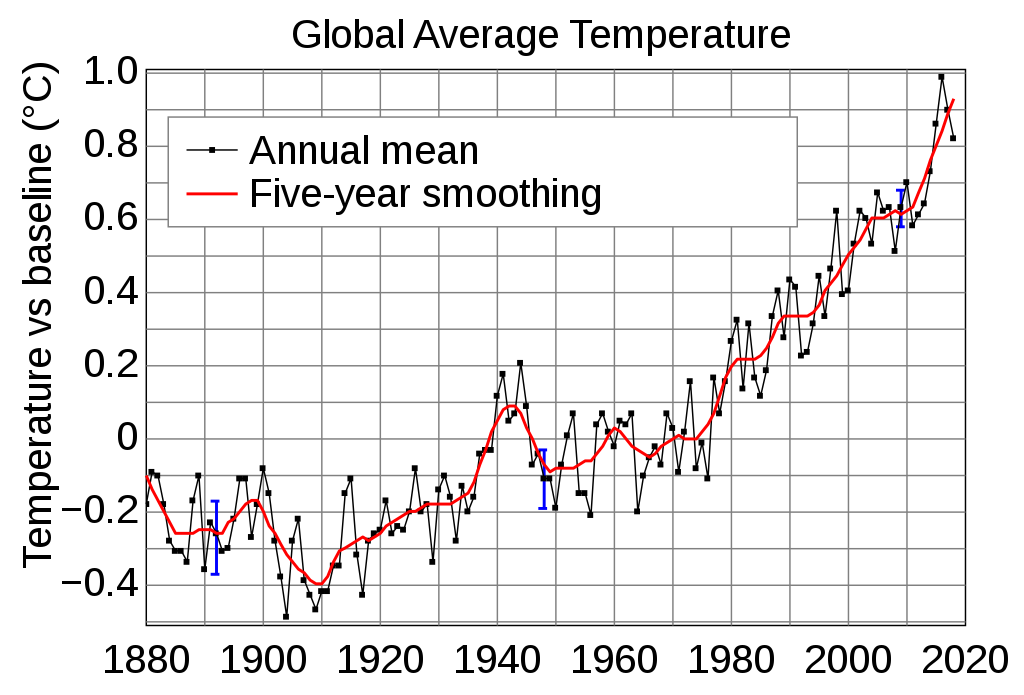
from Wikipedia page named
Instrumental Temperature Record
This graph (if it represents AIR temperature at the surface
of Earth) indicates that the rate of change is about
0.9 deg-Centigrade over a period of about 40 years (1975-2015)
--- which is an increase of about 0.9 / 40 = 0.0225 deg-C per year.
This is in rough agreement with what one would expect
from the 'direct heating' of air by burning of fossil fuels
(about 0.1 degC/yr)
--- in addition to the 'trapping' of solar infrared radiation
by greenhouse gases
... especially if one considers that ...
when the cooling effect of Arctic-Greenland-Antarctic-glacier
ice is terminated when that ice melts away, we may see
the rate-of-increase of planet temperatures increase significantly
from about 0.02 deg-C per year.
Also, consider that some of the heat in the air is
transferred into the oceans --- and into the land masses
--- thus lowering the temperature rise of the air.
That 'bump' around 1939-1945 is probably due to the increase in
heat from accelerated manufacturing and consumption of fuel by
planes, ships, tanks, and other vehicles during World War II.
The following plot of global temperature change, over more than
a thousand years, indicates that the temperature at
the surface of planet Earth has gone 'on a tear'
from about 1850 to 2015 --- in other words, ever since the
'Industrial Revolution'
--- ever since burning of coal, and then oil-and-gas,
increased drastically --- helped along by a recent explosion in
human population on the planet (see population graphs below).
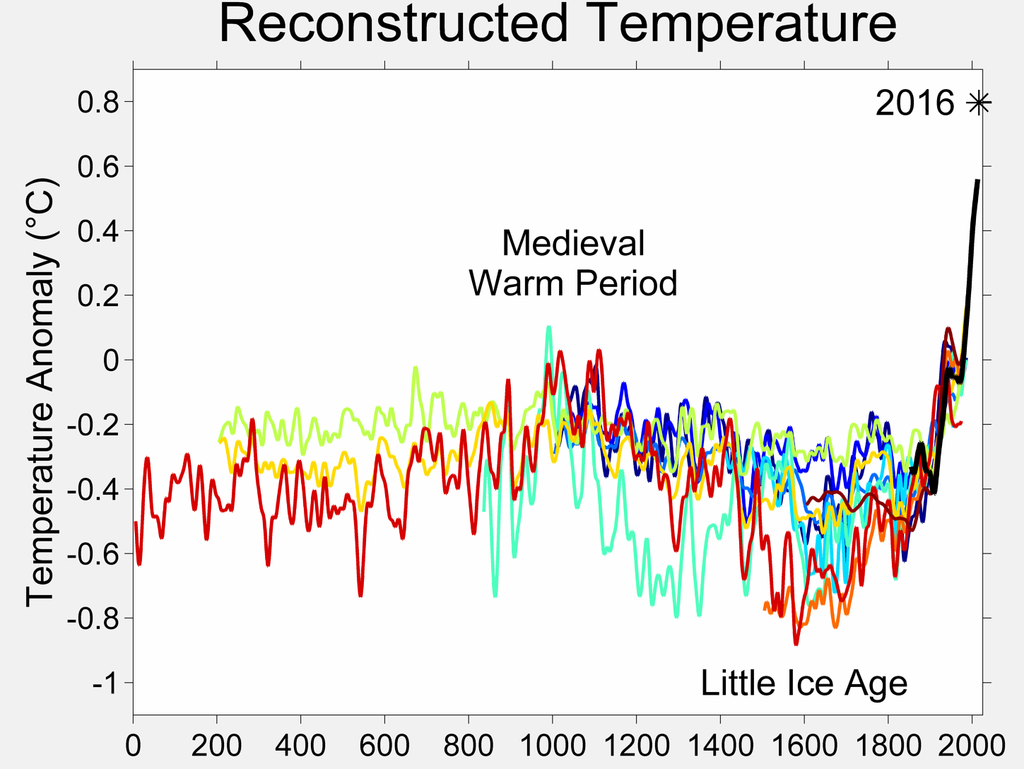
from Wikipedia page named
Temperature Record of the past 1000 years
You could do a WEB SEARCH on keywords such as
global atmospheric temperature rise graph image
to find other (and more current) data on atmospheric temperature rise.
Note that, because the larger cities of the world probably have a good
temperature record since about 1850 or 1900, you could build your own
temperature graphs (over a period of about 1900 to the present) using
data from cities scattered over the Northern and Southern Hemispheres
--- cities such as
- New York City, New York
- San Francisco, California
- Houston, Texas
- Chicago, Illinois
- Toronto, Canada
- Mexico City, Mexico
- Rio de Janiero, Brazil
- Buenos Aires, Argentina
- Santiago, Chile
- Lima, Peru
- London, England
- Paris, France
- Madrid, Spain
- Vienna, Austria
- Istanbul, Turkey
- Cairo, Egypt
- Nairobi, Kenya
- Capetown, South Africa
- Lagos, Nigeria
- Moscow, Russia
- Shanghai, China
- Tokyo, Japan
- Melbourne, Australia
- etc.
A plot of the average of all the city temperatures (using, say,
average temperatures in each month of the year) ---
or a plot of the individual city temperature curves on
one graph --- over the period 1900 to present --- would,
no doubt, confirm the shape of the above graphs.
---
These air-temperature-rise figures (about 0.02 to 0.1 deg-C per year)
do not sound like much of a temperature rise, but, since this
applies all over the globe, it will definitely result in
-
turning the Middle East (and Equatorial regions) into
unbearable hot boxes --- which is already happening
in 2019
-
turning low-lying islands in the Pacific and Indian
Ocean (and elsewhere) into submerged reefs --- which is
already happening in 2019
-
turning massive snow and ice fields in mountains, in
the Arctic, in Greenland, and in the Antarctic into
ice-less regions (which will leave Earth even more
subject to accelerated air temperature increases when the
buffering effect of the
heat of melting of ice is no longer available) ---
which is already happening in 2019
-
turning the state of California into an annual
forest fire tinderbox, with loss of thousands of
homes and generation of an atmosphere of choking, unhealthy
smoke --- which is already happening in 2019
-
and this list could go on and on and on and ...
especially as the generation of 'old-solar-energy' by burning unearthed
fossil-fuels is COUPLED WITH accumulation of 'current-solar-energy'
in the form of infrared radiation being 'trapped' by greenhouse gases.
---
The effects on Mother Earth may be coming faster than this
analysis suggests. For example, the human population growth on
Earth is exploding --- as graphs like the following show.
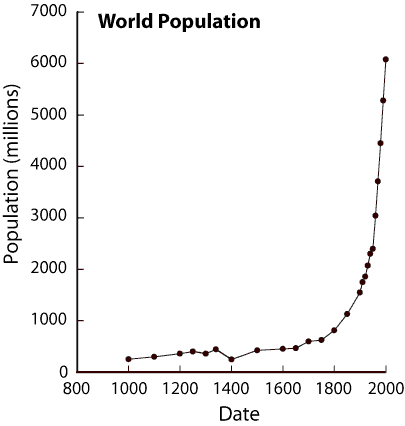
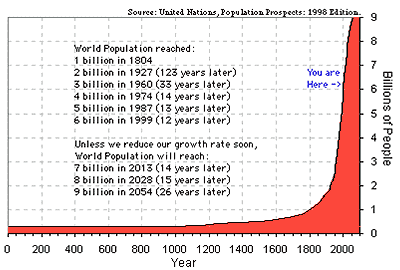
Just as the human population is expected to increase about 50%
(about 4 billion people) in the time period 2020-2040,
the burning of fossil fuels can be expected to increase
about 50% as well (by about 3 x 10^20 additional joules per year) ---
if those fuels last that long and are affordable that long.
So the temperature-rise-per-year estimates above are
under-estimates, because fossil-fuel use will probably
increase significantly in coming years --- unless humans
come to their senses and use non-fossil-fuel (and non-radioactive,
non-extremely-dirty) energy sources such as wind turbines,
solar-panels, hydro-electric dams, ocean energy, and
geothermal energy sources --- in place of the fossil fuels
(and long-lived radioactivity) being used for electricity generation.
The fossil fuels could continue to be used for
many years for purposes such as truck, airplane,
train, and ship propulsion. But there could be
a gradual migration to other propulsion methods
--- such as electric trains instead of diesel trains,
and electric buses instead of diesel buses.
Complicated heat transfer issues:
There are complicating factors for computations like these, such as
-
the kinetic energy in all those N2 and O2 molecules will
transfer some of their energy into the ice and snow on
Earth's oceans and land masses --- in which the
heat of melting represents a huge energy 'sink'
-
the kinetic energy in all those N2 and O2 molecules will
transfer some of their energy into the watery/fluid/flowing
surface of the Earth's oceans
-
the kinetic energy in all those N2 and O2 molecules will
transfer some of their energy into the solid surface of the
Earth's land masses.
I welcome anyone to build
computer models of the complex heat transfer processes
going on every day on Mother Earth.
Like the computer models of 'near-term' weather changes,
there can be many different 'long-term temperature rise'
computer models --- each giving somewhat different
(or drastically different) results.
Here 'near-term' means about a week, and 'long-term'
means about 5 decades.
The results of 'near-term' climate models provide the graphic
predictions that we see on TV station weather reports every day.
The 'long-term' models that consider only 'greenhouse gas' effects
WITHOUT considering the 'direct heating' effect of fossil fuels
can be expected to give 'drastically different' results from
those models that do consider 'direct heating'.
I leave it to others to devise such complex models ---
perhaps to be run on supercomputers (which I do not have) ---
perhaps to simulate the evolution of heat flows both in time and
at specific 3D-coordinates near the surface of the Earth
--- using numerical-integration of complex systems of
differential equations.
Note that the developers of 'long term' climate models could
use the world temperature data from about 1850 to 2000 (as
seen in graphs above) to help validate their models to a
certain extent.
---
I 'bail out' here with the following observation.
If 'near-term' weather models (used daily in weather reports
on TV news channels) are found someday to give
much better predictive results by taking into account the heat
being generated by urban and manufacturing areas of the planet,
then that will give some credence to my thesis here :
Namely, that the 'direct heating' of N2 and O2 molecules
(by the burning of fossil fuels) has a significant
effect on the rising temperature of Earth's atmosphere ---
perhaps an even greater effect than the effect of solar
radiation trapped by 'greenhouse gases'.
The fossil fuel companies --- like Exxon-Mobil and coal companies
--- have probably known this for years, but do not want the
general populace to know this.
The fossil fuel companies probably prefer that people think
CO2 is the only culprit,
so that they can get big government contracts to build
CO2 'sequestration'
boondoggle projects. (The oil companies use that
'sequestered' CO2 gas pressure to get even more fossil fuel
out of the ground. Someday these boondoggles will be exposed,
it is just a matter of time.)
In Conclusion:
Ironically, the Middle East (a major source of fossil fuel)
is complicit in turning its region of the world into an
unbearable hot box that is quite unfriendly to human life.
Good luck, future generations of humans (and other life) on Earth.
|


