Deaths-versus-Age (2018)

(death-counts
versus
age-in-years)

'Peninsula' data


A Data Table for Plotting
a Distribution Profile

Home > RefInfo menu >

Diet and Medical Info menu >

Deaths-versus-Age Data MENU page >

This 'Deaths-versus-Age-Table (2018)' page

! Under Construction !
More data may be added.
And data plots may be added or updated.

Introduction to the table :

This page provides a table of 'number-of-deaths versus age' data --- for 'the Peninsula' --- for the year 2018.

The nature of the data collected is discussed on the 'parent page' of this page --- a 'menu-of-tables' page.

The data is presented below in a simple 'raw text' format --- so that it can be easily collected into a text file and fed into a plot utility.

    
    #   Age       Count of      Count of
    # (years)    MALE deaths   FEMALE deaths
    #----------  -----------   -------------
    
    less-than-1      0             0
      1              0             0
      2              0             0
      3              0             0
      4              0             0
      5              1             0
      6              0             0
      7              0             0
      8              0             0
      9              0             0
     10              0             0
     11              0             0
     12              0             0
     13              0             0
     14              0             0
     15              0             0
     16              1             0
     17              1             0
     18              1             0
     19              1             1
     20              2             0
     21              0             0
     22              0             0
     23              1             0
     24              1             0
     25              1             0
     26              0             0
     27              0             1
     28              1             1
     29              0             0
     30              0             0
     31              1             0
     32              0             0
     33              0             0
     34              3             0
     35              1             0
     36              0             0
     37              0             0
     38              0             1
     39              4             0
     40              1             1
     41              0             0
     42              0             0
     43              1             0
     44              0             0
     45              1             2
     46              0             0
     47              0             1
     48              1             0
     49              3             0
     50              1             2
     51              1             2
     52              4             1
     53              2             3
     54              5             1
     55              2             3
     56              5             2
     57              7             1
     58              6             2
     59              5             1
     60             10             5
     61              4             9
     62              2             3
     63              1             7
     64              6             3
     65              7             3
     66              3             2
     67              3             4
     68              8             5
     69              5             1
     70              9             2
     71             16             4
     72              6             8
     73             14             4
     74              9             5
     75              4            10
     76              6             5
     77              4            17
     78              7             4
     79              6            13
     80             11             8
     81              8             6
     82              8            14
     83              8            15
     84              9            11
     85              8            16
     86             15            12
     87             10             9
     88             11            20
     89              7             9
     90             13             8
     91              9            14
     92              6            15
     93              6            13
     94              5             5
     95              7             8
     96              4            10
     97              3             8
     98              1             5
     99              1             7
    100              0             1
    101              0             2
    102              0             0
    103              0             1
    104              0             1
    105              0             0
    106              0             0
    107              0             0
    108              0             0
    109              0             0
    110              0             0
    111              0             0
    112              0             0


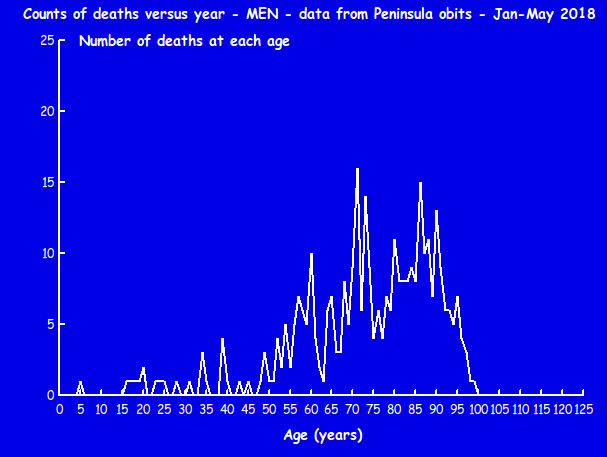
A sample plot of preliminary data - for men
from obituaries in the Jan to May 2018 time frame.


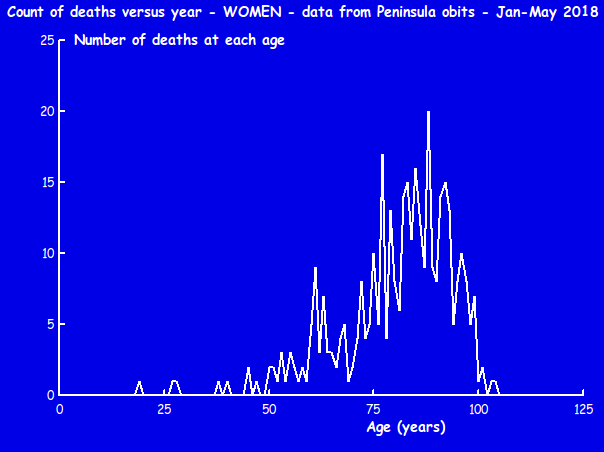
A sample plot of preliminary data - for women
from obituaries in the Jan to May 2018 time frame.

A 'cumulative-percent' plot may be more instructive.
It can give an idea of the age by which 50% or 75% or 90% of deaths occur.
Such a plot may be added here in the future.

Bottom of this
'Deaths-versus-Age Table - Peninsula - 2018' page.

To return to a previously visited web page location, click on the Back button of your web browser, a sufficient number of times. OR, use the History-list option of your web browser.
Or ...

< Go to Top of Page, above. >

Or simply scroll up to the top of this page.


Page was created 2018 May 20.
(Started with data from ~68 days of obituaries, in Jan-May 2018 period.)

Page was changed 2019 Feb 19.
(Added css and javascript to try to handle text-size for smartphones, esp. in portrait orientation.)

The plan is to add data for months Jun-Dec to the table above.