


Reference:
http://wiki.openstreetmap.org/wiki/ Slippy_map_tilenames#Zoom_levels
Brief overview:
OSM tiles are 256x256 pixel PNG files.
With each additional zoom-level,
the number of OSM tiles that
cover the (non-polar) Earth goes up
a factor of 2 x 2 = 4.
Filename (URL) format is ... tile.openstreetmap.org/zoom/x/y.png
where
zoom=zoom-level-integer (from 0 to 19),
x=longitude-locator-integer (non-negative column number),
y=latitude-locator-integer (non-negative row number).
In the link above, see sample code to calculate x and y
for a given zoom-level and a given latitude and longitude.
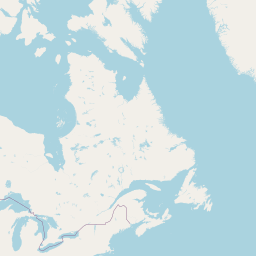
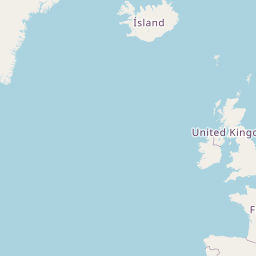
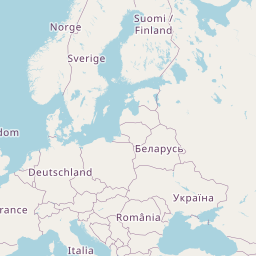
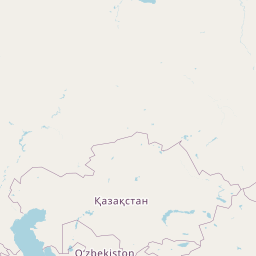
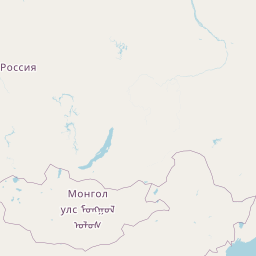
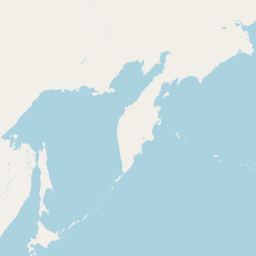
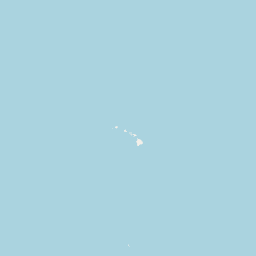
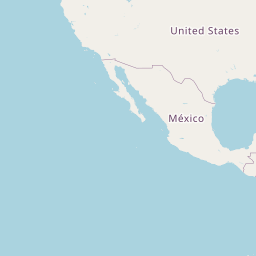
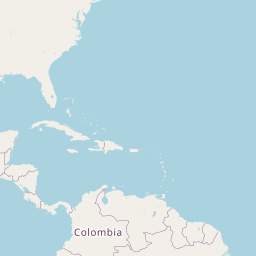
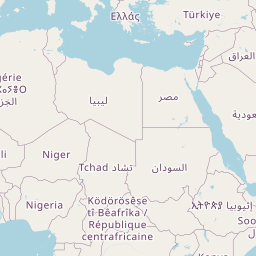
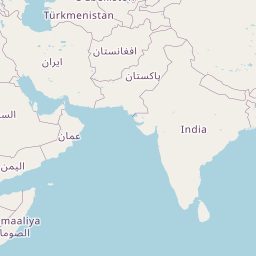
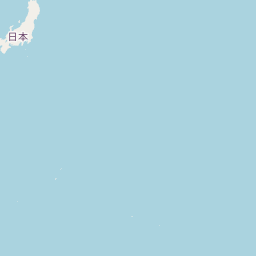
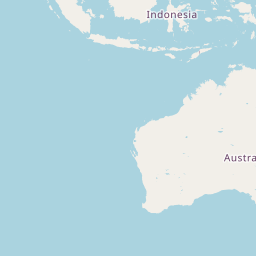
The following Earth map
is done with OSM map tiles
at OSM zoom level 3.
Each OSM tile is a 256x256 pixel PNG file.
Each zoom-level-3 tile is one image of
2^3 x 2^3 = 8 x 8 = 64 images
which are used by OpenStreetMap to
cover most of the Earth --- except for
near the North and South poles.
These zoom-level-3 tiles go from
x-numbers 0 to 7. (8 columns)
These zoom-level-3 tiles go from
y-numbers 0 to 7. (8 rows)
Total: 8 x 8 = 64 tiles
Image width: 8 x 256 = 2,048 pixels
Image height: 8 x 256 = 2,048 pixels
Each Level-3-tile in the x-direction represents
360 / 8 = 45 degrees of longitude.
Each Level-3-tile in the y-direction represents
roughly 170 / 8 = 21.25 degrees of latitude.
Hence, the centers of each of the 8 columns of tiles
in the x-direction are (in degrees)
1) -180 + 22.5 = -157.5
2) -157.5 + 45 = -122.5
3) -122.5 + 45 = -67.6
4) -67.6 + 45 = -22.5
5) -22.5 + 45 = 22.5
6) 22.5 + 45 = 67.5
7) 67.5 + 45 = 112.5
8) 112.5 + 45 = 157.5
These are longitudes.
And, the centers of each of the 8 rows of tiles
in the y-direction are (roughly) in degrees
1) 85 - 10.625 ~ 74.4
2) 74.4 - 21.25 ~ 53.2
3) 53.2 - 21.25 ~ 31.9
4) 31.9 - 21.25 ~ 10.6
5) 10.6 - 21.25 ~ -10.6
6) -10.6 - 21.25 ~ -31.9
7) -31.9 - 21.25 ~ -53.2
8) -53.2 - 21.25 ~ -74.4
These are latitudes.
(These latitude numbers need some adjustment --- especially near
the extremes of +85 and -85 degrees. This is a linear
interpolation to specify the center of each tile when it should be
more like a logarithmic interpolation.)
Using these longitude and latitude coordinates,
the approximate center of each of the 64 level-3 tiles
--- in latitude and longitude degrees --- can be seen in this array :
         0            1            2           3           4          5          6           7

0    74.4,-157.5  74.4,-122.5  74.4,-67.6  74.4,-22.5  74.4,22.5  74.4,67.6  74.4,122.5  74.4,157.5

1    53.2,-157.5  53.2,-122.5  53.2,-67.6  53.2,-22.5  53.2,22.5  53.2,67.6  53.2,122.5  53.2,157.5

2    31.9,-157.5  31.9,-122.5  31.9,-67.6  31.9,-22.5  31.9,22.5  31.9,67.6  31.9,122.5  31.9,157.5

3    10.6,-157.5  10.6,-122.5  10.6,-67.6  10.6,-22.5  10.6,22.5  10.6,67.6  10.6,122.5  10.6,157.5

4   -10.6,-157.5 -10.6,-122.5 -10.6,-67.6 -10.6,-22.5 -10.6,22.5 -10.6,67.6 -10.6,122.5 -10.6,157.5

5   -31.9,-157.5 -31.9,-122.5 -31.9,-67.6 -31.9,-22.5 -31.9,22.5 -31.9,67.6 -31.9,122.5 -31.9,157.5

6   -53.2,-157.5 -53.2,-122.5 -53.2,-67.6 -53.2,-22.5 -53.2,22.5 -53.2,67.6 -53.2,122.5 -53.2,157.5

7   -74.4,-157.5 -74.4,-122.5 -74.4,-67.6 -74.4,-22.5 -74.4,22.5 -74.4,67.6 -74.4,122.5 -74.4,157.5
NOTE:
There may be some adjustment to these values
in the future, to position the 'slippy maps'
in a better initial position (for example,
over a land area,
rather than in the midst of an ocean).
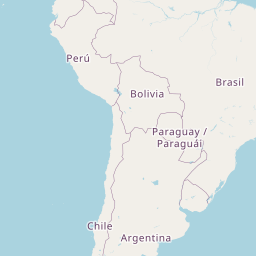
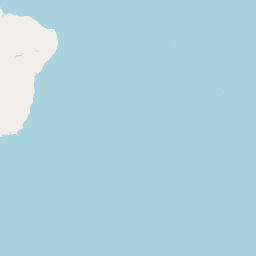
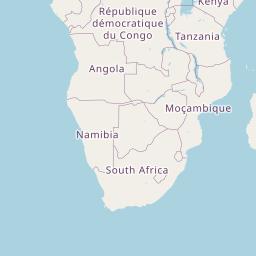
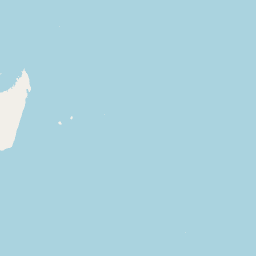
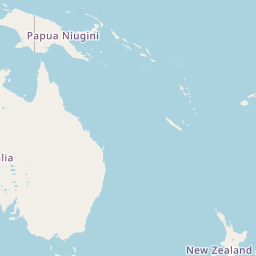
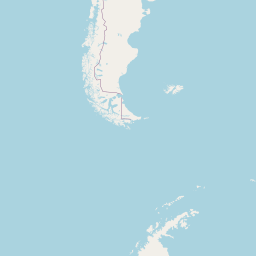
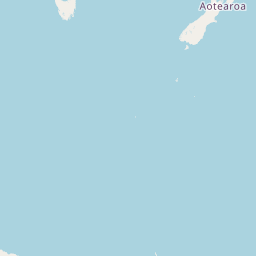
Each one of the 8x8 = 64 tiles below is a link to an
OSM (Open Street Map) service that provides a 'slippy map'
that is located at that tile --- at an appropriate zoom-level
that positions you for exploration of that area of the Earth.
Simply click on a tile to bring up a 'slippy map' in a
separate window (or tab) of your web browser.
Note that about 18 of the 64 tiles are over 'heavily' populated areas.
So about 18 / 64 ~ 30% of these tiles will receive the most clicks.
About 64 - 18 = 46 of these tiles are expected to receive
few, if any, clicks.
|
|
|
|
|
|
|
|
|
|
|
|
|
|
|
|
|
|
|
|
|
|
|
|
|
|
|
|
|
|
|
|
|
|
|
|
|
|
|
|
|
|
|
|
|
|
|
|
|
|
|
|
|
|
|
|
|
|
|
|
|
|
|
|
|
|
|
|
|
|
|
|
Since the circumference of the Earth
is 40,075.16 kilometers (24,901.55 miles),
for OSM tiles at the equator, the width
of each tile represents:
  40,075.16 kilometers (24,901.55 miles) at OSM zoom-level-0
  20,037.58 kilometers (12,450.77 miles) at OSM zoom-level-1
  10,018.79 kilometers ( 6,225.39 miles) at OSM zoom-level-2
   5,009.40 kilometers ( 3,112.69 miles) at OSM zoom-level-3
   2,504.70 kilometers ( 1,556.35 miles) at OSM zoom-level-4
   1,252.35 kilometers (   778.17 miles) at OSM zoom-level-5
     626.17 kilometers (   389.09 miles) at OSM zoom-level-6
     313.08 kilometers (   195.54 miles) at OSM zoom-level-7
     156.54 kilometers (    97.27 miles) at OSM zoom-level-8
      78.27 kilometers (    48.64 miles) at OSM zoom-level-9
      39.14 kilometers (    24.32 miles) at OSM zoom-level-10
      19.56 kilometers (    12.16 miles) at OSM zoom-level-11
       9.78 kilometers (     6.08 miles) at OSM zoom-level-12
       4.89 kilometers (     3.04 miles) at OSM zoom-level-13
       2.45 kilometers (     1.52 miles) at OSM zoom-level-14
       1.22 kilometers (     0.76 miles) at OSM zoom-level-15
       0.61 kilometers (     0.38 miles) at OSM zoom-level-16
        305 meters     (      334 yards) at OSM zoom-level-17
        153 meters     (      167 yards) at OSM zoom-level-18
         76 meters     (       83 yards) at OSM zoom-level-19
   (a little less than the length of a fusbol/football field)
To construct the table above,
we took half of the previous width
at each zoom-level.
NOTE:
At the equator, each tile (above) at zoom-level-3
represents about 5,000 kilometers (or 3,100 miles)
in width (x-direction) and height (y-direction)
on the surface of the Earth.
Page history:
Page was created 2019 Feb 21.
Page was changed 2019 Sep 16.
(Added a note on the need to adjust the degrees used to
initially position the 'slippy tiles' in the latitude
direction --- especially the tiles near the south and north poles.)