Bush ENVIRONMENT Images
|
|
Bush ENVIRONMENT Images |
|
Home page >
Picture Categories menu >
Bush Library, Main Lobby >
This Bush ENVIONMENT Images page
|
INTRODUCTION: Below are images of George W. Bush, in relation to the Environment --- U.S. and global. Theodore Roosevelt did a lot to preserve precious lands in the National Parks system. In contrast, at the end of Bush's administration, in 2008, Bush-and-friends were busy trying to sell off (or at least lease off) a huge amount of federal lands to friends.
<sarcasm> Hopefully environmental lawyers were able to head off most of the damage. On Proof of Global Warming : Since there is still a lot of controversy about whether global warming is really occurring, I will not post global warming images here until I can assemble evidence that would convince a vast majority of persons on the street. Al Gore mentioned in testimony before Congress in early Feb 2009 that he wished he had a more persuasive way to present a case for global warming (or words to that effect). That indicates that even he is aware that his Powerpoint presentations have not presented the evidence in a truly convincing form. I wish someone would present actual satellite photos (relatively un-doctored other than piecing together multiple photos of the North or South polar areas) of the same day or week in mid-January , from about 1978 (when satellite photos were becoming fairly common) to the present. For corroborating evidence, I would like graphs of water (and air) temperature maximums (and/or mimimums) taken, from the mid-1970's, or, if available, from the 1800's to the present, the same day or week in mid-January, and at the same spot (that is, latitude and longitude) and water depth. (In the case of air temperatures, the readings should be taken at the same height and with the same wind and sun protection.) Ice thickness measurements (taken directly, not by radar and the like) would be helpful. But it is not likely that a full set of measurements (at the very same spot or spots) can be found, mid-January, for every year from the mid-1970's to the present. I have been unable to find such distinct evidence (satellite photos, temperature readings, ice thickness) in web searches (in Feb 2009). Many maps are "simulated" maps of ice extent --- either 2D outline or colored-areas maps --- or 3D-like maps, using shading to emulate shadows of mountains of Greenland. Such "simulated" ('once-removed') maps look nice, but they are not convincing when you think about the judgments that went into showing the ice. The ice seen in satellite photos is not nearly so clearly delineated, but you would certainly be able to tell open water from thick ice in photos --- if you can get enough photos on non-cloudy days. Hopefully, better compilations of images and data will be available after 2009. The best bet for accumulating such photo-assembled views, from about 1975 to the present (in mid-January, preferably, for the Arctic), seems to be the NOAA (National Oceanic and Atmospheric Administration) and NASA (National Aeronautics and Space Administration) in the U.S. Other possible sources are 'near-polar' countries such as Russia, Scandinavia, England, Iceland, Australia, and New Zealand. It seems that the NOAA and NASA could probably settle the issue --- if political interference could be eliminated and the scientific method could be employed, exclusively. I have to wonder whether Bush and his advisor-lobbyist cronies were, in 2001-2008, preventing NOAA and NASA from objectively assembling the photos and temperature graphs that would answer the question --- ONE WAY OR ANOTHER. Bush and his advisor-lobbyist cronies, no doubt, would fear that the outcome would not be to their liking. (You just can't trust those scientists to 'do the right thing'. They're just not like marketing people.) Until I can assemble much better evidence than I have found so far for global warming, I will collect global warming data and images (including Bush photos and cartoons) --- just in case I can find enough evidence so that even FoxNews will have to accept it. On Effects of World Population Growth : There is plenty of reason to believe that man is having a significant effect on climate --- simply by looking at graphs of world population growth, say, from year zero to the present. I have presented a compendium of such world population graphs at this blog page. Unfortunately, more-than-exponential world population growth is 'secondary' evidence. So I plan to collect and organize 'primary' evidence of
and the like. I know that, in Virginia, man is having a devastating effect on fishing, crabbing, and oystering in the Chesapeake Bay on the U.S. East Coast. No doubt, Rush Limbaugh, Bill O'Reilly, and other 'neo-cons' are continually thinking up ways to argue against man's culpability in such matters. Or they simply say 'so what?' If the human population is exploding exponentially --- it's good for the economy. They seem to be willing to 'trash the planet' --- while they imply that there is no other alternative that would preserve a robust economy. The 'so what' is that the fisheries are dying --- and, besides the loss of food sources, dying fisheries is not a good sign for the future of water quality for man either. And there is little doubt vast areas of Brazil (and Africa) are being de-forested --- and de-forested exponentially (until gone). The effects are being debated, but there is little doubt that much harm is being done. Of course, those doing the harm would argue that it is worth it. Time will tell. Unfortunately, time is fast running out, as the world population graphs referred to above demonstrate rather dramatically. Pity poor Mother Earth. Act for her. Cast votes on her behalf. Write your Senators and Representatives. And donate to action organizations such as EarthJustice.org. On Clear-cutting --- and bare mountains : On the subject of clear-cutting of forests, I have some personal experience with that. On a trip down the West Coast in June 2007 (from Washington through Oregon and northern California), I saw many cases of clear-cutting entire hills and small mountains and mountain tops. One case that was particularly disgusting to me was around a town in southern Oregon, near the coast, where about 5 or more adjacent hills were completely de-nuded of trees. That seems highly over-done to me and very un-wise from the point of view of water-runoff ( soil erosion, drinking water contamination, etc.) --- as well as wildlife habitat and plain old aesthetics. It seemed to be a trailer-court and motorcycles-on-sand-dunes type of community. No apparent community pride. In my opinion, people like this have given up their right to live with the rest of society. They should be parachuted onto an Aleutian island and allowed to suffer the consequences of each other. For MORE Images and Data: This 'ENVIRONMENT' wing is little more than a place-holder at the moment. I hope to add images of the effects of removal of mountaintops --- in West Virginia, being removed for coal mining --- with the residue being dumped in valleys, thus wiping out streams and obliterating proper water runoff. I also hope to find images related to water quality, air quality, and nuclear disposal issues. For more images (and data) for this wing, see the WEB SEARCHES section below. Those searches may suffice in case I never return to add to the pictures on this page. |
![]()
![]()
![]()


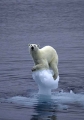
This is a timeline of what could be expected to happen
if Man suddenly disappeared from the Earth, today.
It gives a picture of when traces of Man's existence
would disappear.
NOTE :
Nuclear waste can remain deadly for 2 million years.
BRIGHT SPOTS :
At 20 years, Genetically-Modified crops disappear.
At 50 years, fish stocks recover.
At 1,000 years, CO2 in atmosphere back to pre-industrial levels.
(But the important question is -
When do temperatures return to pre-industrial levels?
Approximately 1,000 years?)
|
WEB SEARCHES FOR It may be a long time (years or never) before I get back to this page to add more images, so here are some links to WEB SEARCHES for more images and info.
WEB SEARCH on keywords
WEB SEARCH on keywords
WEB SEARCH on keywords
WEB SEARCH on keywords
WEB SEARCH on keywords
WEB SEARCH on keywords Also, you can go to suitable Wikipedia pages and follow links from there, such as |
|
Bottom of this To return to a previously visited web page location, click on the Back button of your web browser, a sufficient number of times. OR, use the History-list option of your web browser. OR ...
< Go to Top of Page, above. >OR you can scroll up to the top of this page. Page history:
Page was created 2009 Feb 07.
|