CEO Pay Ratios

(CEO Compensation
divided by
'median employee'
compensation)

(for about 200-plus companies
in a SORTABLE table)


(with some 'external' links to
info on the companies and
their financial data)


This is a page to help bring attention to
the accelerating rate of CEO (and NEO)
compensation increases --- and the
widening gap between
the 'top-one-percenters' and
the 'other-ninety-nine-percenters'
--- sometimes graciously referred to
as the 'middle class' --- instead of
bringing to mind the 'lower classes'
and the homeless.

Home > RefInfo menu > Investing menu >

This 'CEO Pay Ratios' page

! Note !
Some text and data and links may be added (or
changed) on this page --- if/when I re-visit this page.

Sections below:

INTRO     DATA-info     Sortable-HTML-Table

COMPENSATION-NOTES     MORE-INFO-links     CONCLUSION

INTRODUCTION :

On a different web page, I present 'earlier' & 'later' years of CEO compensation and Company Revenues in a table whose data columns (compensation & revenues & more) are sortable.

That sortable table gives 'absolute' figures that show the size of CEO (Chief Executive Officer) compensation --- relative to other CEO's and relative to the company revenues --- for a pair of years.

That sortable table also gives 'percent-per-year' figures that show the rate of change of CEO-compensation & company revenues.

This page is meant to provide another way of looking at CEO compensation --- namely, relative to the compensation awarded to a 'median' employee of the company headed by the CEO.

The annual 'proxy statements' of companies provide tables of executive compensation for the top NEO's --- Named Executive Officers --- of the company.

In addition to a breakdown of the compensation of the CEO and other NEO's, in 2015, the SEC started requiring that companies provide a 'CEO Pay Ratio' --- along with the NEO compensation information.

This came about in order to implement Section 953(b) of the Dodd-Frank Act, which requires public companies to disclose the "pay ratio" between its CEO's annual total compensation and the median annual total compensation of all other employees of the company.

There is a pretty good explanation of the details at a Harvard Law School page.

The data in the following table:

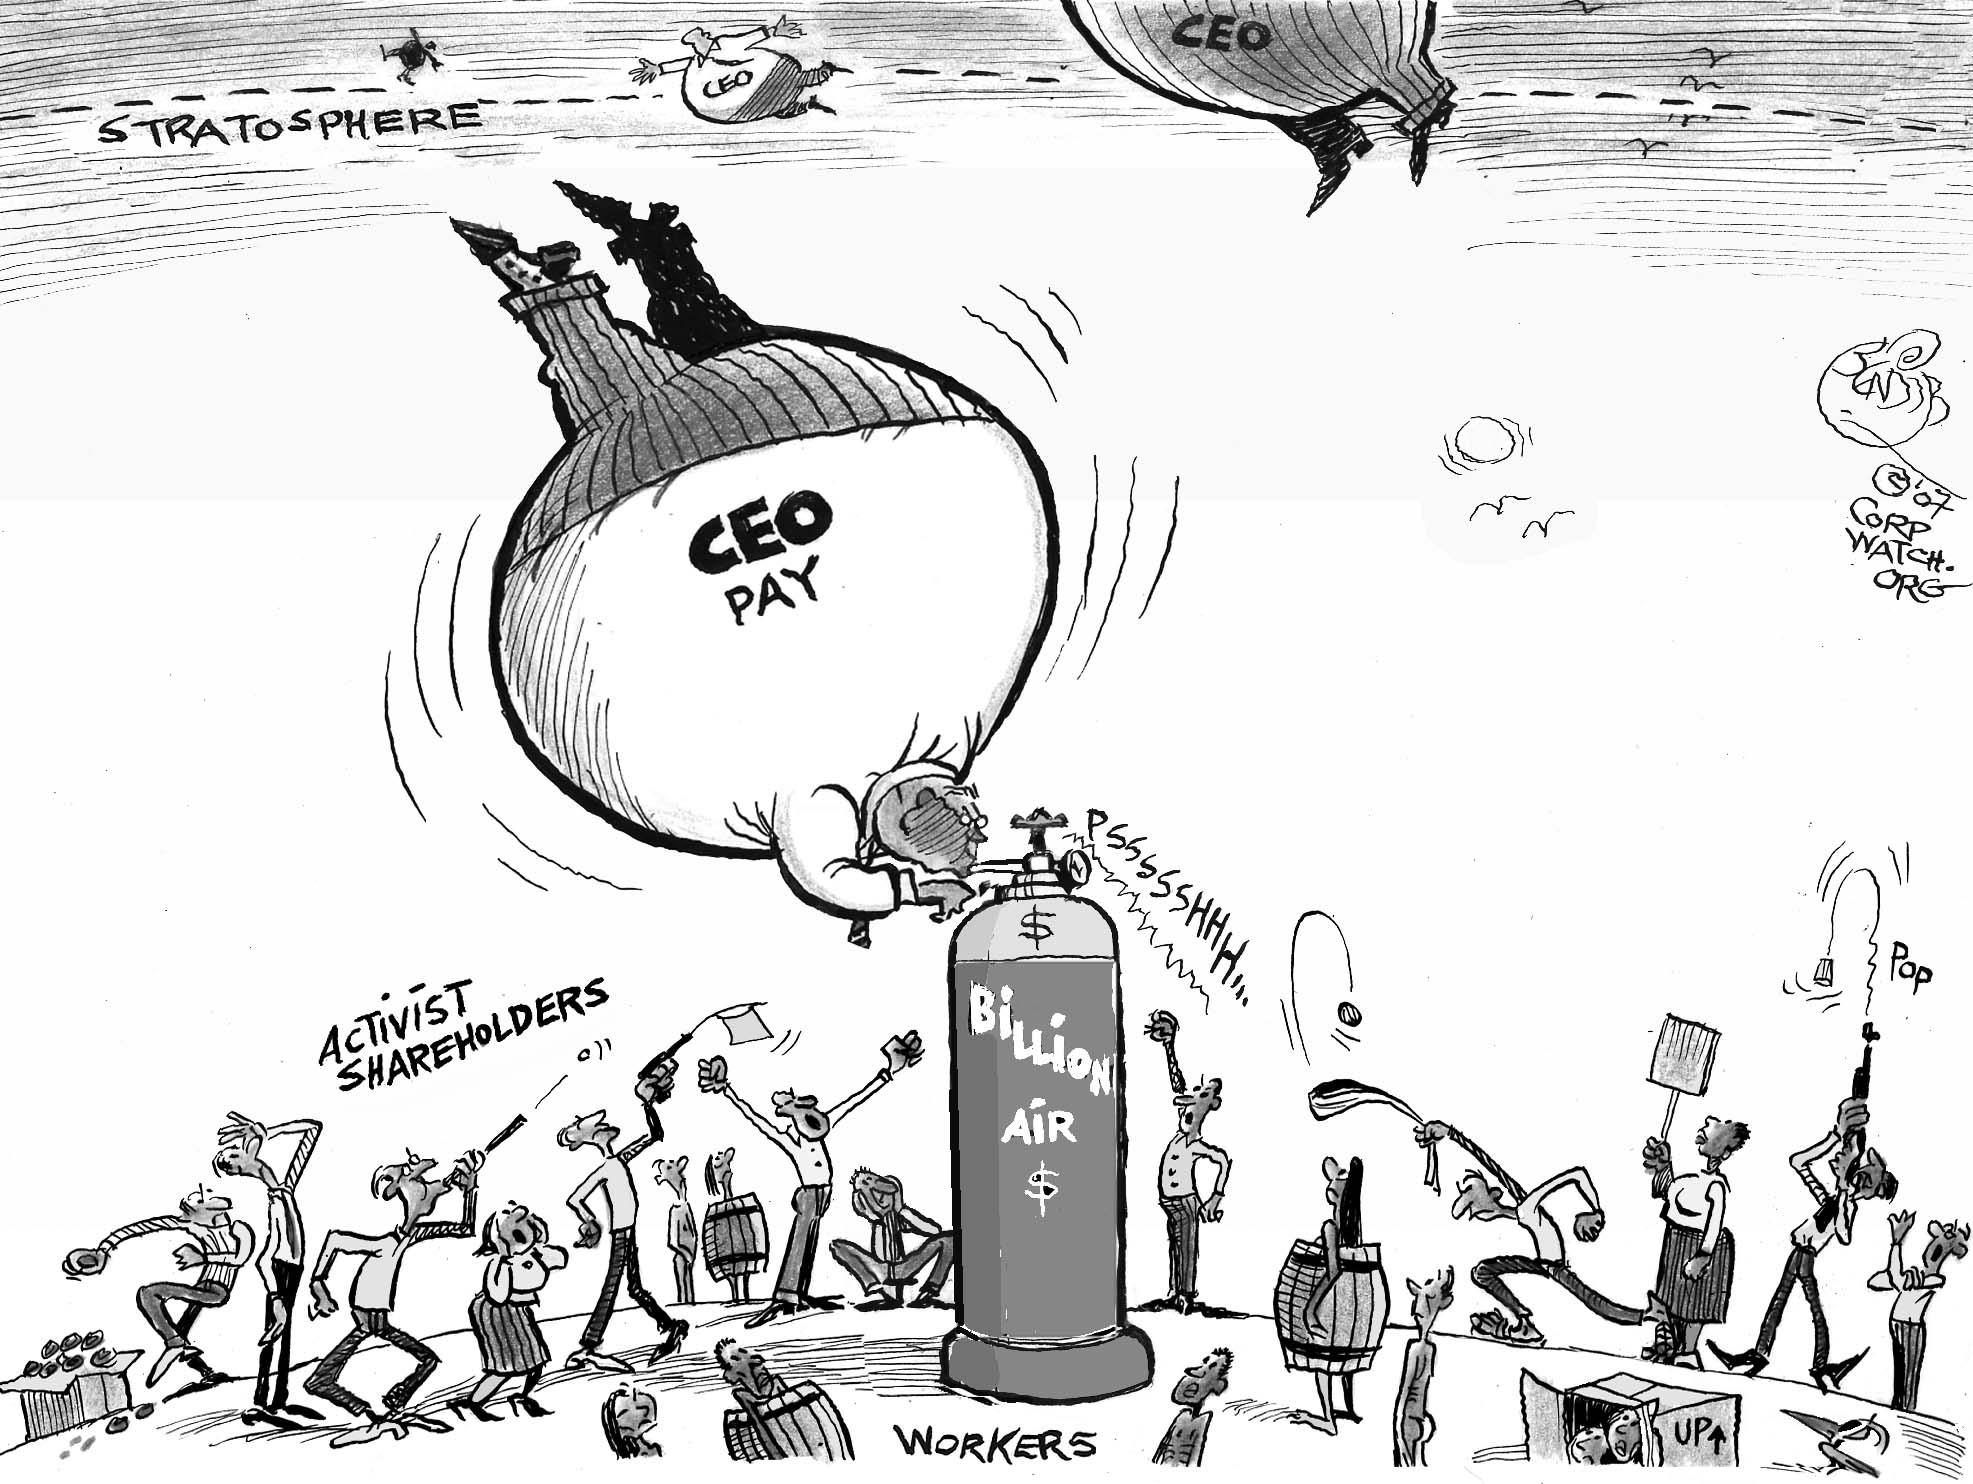
The following data is intended to give me an overview of the companies that may be paying their CEO's (and NEO's) so much that I would have second thoughts about whether those CEO's (and NEO's) are worth the diversion of millions of dollars away from other company functions

--- such as paying shareholders dividends to compensate them for 'parking' their money into the company stock --- and functions such as putting money into assets and company employees that will enhance the value of the company.

    You might notice that there are some 'always in the news' companies missing from this list --- such as auto-makers like General Motors and Ford --- and financial institutions like Wells Fargo and Goldman Sachs.

    These are companies that I will probably never invest in --- for one reason or another.

    However, you can use links on this page to find this data for companies other than the 200-plus below.

The data consists of columns for:

  • company name
    (which a link to a web page that gives general information about the company)

  • company stock symbol
    (which is a link to a site with much more financial information about the company)

  • Year of the following data
    (the year-of-the-data from the 'proxy statement' that contained the ratio data)

  • reported CEO pay ratio,
    which shows great variability --- from about 10 to the 1000's
    (which is a link to a 'salary.com' page that gives CEO-pay-ratio data)

  • reported CEO compensation
    (in millions of dollars)

  • reported compensation of a 'median employee'
    (in millions of dollars --- typically a small fraction of the CEO compensation --- on the order of 0.1 or less)
    (NOTE: a number like .0754 means $75,400 per year
    so any number less than 0.0500 is compensation less than $50,000/year)

  • total number of employees
    (which is a link to a 'macrotrends.net' page that presents a bar chart of yearly employee counts)

  • total number of U.S. employees
    (if readily available)

  • related notes

The data can be sorted by clicking on any column heading.

The data (pay-ratio & CEO-compensation in millions) are presented to about 3 'significant digit' accuracy.

Three digits are sufficient to express the reported values to within one percent accuracy (or better).

For the purposes of this sortable table, presenting more digits would be 'over-kill'.

In the table columns, 'TBD' = 'To Be Determined'. TBD entries sort to the top of the table (ascending sort) or to the bottom of the table (descending sort).


Sources of the data in the table:

The CEO-pay-ratio data (including CEO & median employee pay) was initially obtained (for many of the companies) from their Proxy statements, in various years (circa 2013 to 2021).

Later (in 2022) I found that the pay-ratio data was available at a series of about 100 pages at 'salary.com', or in individual company pages at 'salary.com' (the pay-ratio links below).

I may use data from either source --- proxy statements or 'salary.com'.


The company name is a link for general information on the company. It is a Wikipedia link if there is a page for the company on Wikipedia. If not, the link is a WEB SEARCH on keywords including the company name.


The company stock symbol is a link for financial information on the company. This will usually be a link to a 'key-statistics' page at 'finance.yahoo.com'.


The year-of-the-data will be the year that the company assigned to the CEO-ratio data in their proxy statement.

    (Note that, in most cases, the data is for the company's fiscal-year, not a calendar-year. So we use the year to which the company assigns the data.)


The approximate total employees is a link to a 'number-of-employees' page for the company at 'macrotrends.net'. A bar-chart is presented showing the data for up to about 10 years in the past.


The approximate total U.S. employees is seldom readily available and may be simply entered as 'TBD'. It may take significant further effort to find this data.


The Notes are often some comments pertinent to the pay-ratio that were mentioned in a proxy statement of the company.

Foreign companies (Canadian, German, etc.) typically do not report a CEO-pay-ratio. The 'Notes' column is used to indicate this fact. Although the CEO-pay-ratio is not available for these companies, the CEO-compensation is often reported, but not necessarily in U.S. dollars. The U.S. dollars figure may eventually be filled in for some of these companies.


Data Table Usage (sorting)

You can sort the table according to any data column. So, for example, you can sort the table by 'CEO Pay Ratio' or by 'CEO compensation' or by 'median employee compensation' or by 'number of employees' --- ascending or descending.

You can also sort the table by 'company name' or by 'stock symbol' (a link to a stock-info page) --- the first two columns.

When this web page is (re)loaded, the table rows are presented in order by company name.

    When you are in the middle of the table and are wondering what a number represents (in a cell in a certain row and column), you can position your pointer device over the cell.

    A small popup window will tell you whether the number is a 'pay ratio' or compensation (CEO or median employee) or number of employees (total or U.S.).

    This should work in most web browsers on desktop computers. Perhaps not in browsers on mobile devices such as cell phones and tablet computers.

Some recommended sorts:

Sort the 'CEO-compensation' column to readily see the companies with the largest (and smallest) CEO-compensation figures.

Sort the 'Median-employee-compensation' column to readily see the companies with the largest (and smallest) median-employee-compensation figures.

Sort the 'Total-number-of-employees' column to readily see the companies with the largest (and smallest) number-of-employees.

Sort the 'CEO-pay-ratio' column to readily see the companies with the largest (and smallest) pay-ratio figures.

Sort the 'Year-of-the-data' column to readily see the companies with the most recent (or oldest) data in the table.

    You can use the 'salary.com' and 'macrotrends.net' links to update old data. You are welcome to take a copy of this web page and update it and change it to your liking.


HOW TO SORT

Click on any column heading to sort the data table by the data in the selected column.

The data can be sorted in either ascending or descending order.

Click the column heading again if it is not in the order that you want.


Searching this page :

If you are looking for some particular information, you can use the text search function of your web browser.

For example, if you are looking for information on a specific company, you can enter a character-string such as 'veriz' or 'conoco' in the text search entry field of your web browser, to find info (on this page) on a company such as Verizon or Conoco-Phillips.


More info on these (& other) companies :

Below the data table on this page, there is a section of links to various sites that provide company data on NEO compensation --- and other kinds of company data --- such as 'performance' data, like Revenues and 'Net Income' and current-liabilities(debt) and long-term-liabilities(debt) and 'Debt/Equity-ratio' and Dividends.

Information links for about 800-plus companies are on a single Stock Price Histories web page of this site.

In fact, essentially all of the 200-plus companies on this page are listed on that 'Stock Price Histories' web page.

When you are investigating various companies, you can open that 'Stock Price Histories' page in a separate window while looking at this page --- to see additional information (and info-links) for any of these companies.


Updating this page :

I may fill in some 'TBD' data over time, such as the 'CEO-compensation' for foreign-headquartered companies (in U.S. dollars) and the 'number-of-UnitedStates-employees' data.

I may eventually add more companies to this page, probably taken from the 800-plus companies on the Stock Price Histories web page of this site.

I may also update 'old' data for companies on this page in future years --- probably by using the 'salary.com' and 'macrotrends.net' links --- but don't count on much updating.

I may reach my 'expiration date' before updating can be done. Hence the invitation for anyone to take a copy of this page and maintain it into the future.


Enough of this Introduction.

Below is the 'Data Table'.

< Go to Top of Page, above. >

< Go to Bottom of Table, below. >

< Go to Bottom of this page, below. >

Company Name
&
InfoLink
Stock
Symbol
&
InfoLink
Year
of the Data
CEO
Pay
Ratio
&Link
CEO Comp.
($million)
Median Comp.
($million)
Approx. Total
Employees
&Link
Approx. U.S.
Employees
Notes
A T & T T 2021 231. 24.8 .107 203,000 TBD TBD
AAON Inc. AAON 2021 55.7 2.91 .0523 1,800 1,800 The employee figures include full-time, part-time, and temporary employees.
ABIOMED Inc. ABMD 2022 96. 12.6 .131 1,725 TBD TBD
Accenture PLC ACN 2021 473. 23.0 .0487 624,000 TBD TBD
Activision Blizzard ATVI 2019 319. 30.1 .0943 9,200 TBD TBD
Acuity Brands Inc. AYI 2020 2317. 20.9 .0090 13,000 TBD TBD
Advanced Micro Devices AMD 2021 230. 29.5 .128 15,500 TBD The CEO pay was 'jacked up' in 2019 due to a 'Value Equity Award'. If that award were excluded, the pay ratio would be 172 in 2019.
Agilent A 2019 179. 12.5 .0700 16,048 TBD In 2019, Agilent had employees in 31 countries, with 38% in Asia Pacific --- 26% in Europe, Middle East and Africa --- and 36% in the Americas.
Air Products & Chemicals APD 2021 201. 13.8 .0686 20,875 TBD TBD
Alamo Group Inc ALG 2019 75. 3.20 .0428 4,270 TBD TBD
Alarm.com Holdings ALRM 2021 30. 3.61 .119 1,500 1,483 TBD
Alarm.com Holdings ALRM 2019 29. 3.02 .106 884 872 TBD
Albany International AIN 2021 84. 4.72 .0562 4,100 TBD TBD
Algonquin Power AQN 2021 TBD TBD TBD 3,441 TBD Headquartered in Canada.
Allete Inc ALE 2019 44. 4.71 .107 1,339 TBD TBD
Alliant Energy LNT 2020 55. 11.0 .199 TBD TBD Median employee compensation looks high. They probably included post-retirement benefits & more.
Alliant Energy LNT 2019 56. 7.76 .138 3,597 TBD Median employee compensation looks high. They probably included post-retirement benefits & more.
Alteryx Inc AYX 2019 37. 6.53 .179 1,200 TBD TBD
Amazon.com Inc AMZN 2019 58. 1.68 .0288 798,000 TBD This CEO compensation for Jeff Bezos is ridiculously low. Better to use other NEO compensation, which is over 20.0 million. See the proxy statment for details.
American Electric Power AEP 2019 109. 14.5 .132 17,408 TBD TBD
American States Water AWR 2019 36. 5.00 .140 841 TBD Median employee compensation seems high.
American Water Works AWK 2019 69. 5.92 .0858 6,806 6,806 TBD
Ametek Inc AME 2019 118. 10.2 .0863 18,100 TBD TBD
Amgen Inc AMGN 2021 166. 21.7 .130 24,200 TBD The reported CEO-pay-ratio was 150 in 2019.
Amphenol Corp APH 2019 511. 7.38 .0144 74,000 TBD A majority of the employees are based in 'low cost countries'. The CEO pay ratio for the median U.S. employee is 128 --- based on a median U.S. employee compensation of $57,878 (.0579 million).
Analog Devices Inc ADI 2019 192. 11.9 .0622 16,400 TBD TBD
Ansys Inc ANSS 2021 154. 18.2 .118 5,100 TBD The median employee was located in India.
Anthem Inc ANTM 2019 247. 15.5 .0627 70,610 63,924 Anthem Inc (ANTM) was renamed to Elevance Health Inc (ELV) in 2022.
Apache Corp APA 2019 91. 14.2 .157 2,253 TBD TBD
Apple AAPL 2021 1447. 98.7 .0682 154,000 TBD TBD
Applied Materials AMAT 2019 135. 14.1 .104 22,000 TBD TBD
Applied Materials AMAT 2018 123. 14.0 .114 TBD TBD TBD
ASML Holdings NV ASML 2021 TBD TBD TBD 32,016 TBD Headquartered in the Netherlands.
Atmos Energy Corp ATO 2019 123. 10.4 .0845 4,776 TBD TBD
Audiocodes Ltd AUDC 2020 TBD TBD TBD 773 TBD Headquartered in Israel.
Autodesk Inc ADSK 2019 100. 11.6 .115 9,600 TBD TBD
Automatic Data Processing ADP 2021 261. 16.9 .0649 56,000 TBD TBD
Avery Dennison AVY 2019 692. 8.50 .0123 33,000 4,300 Employees are in over 50 countries --- with over 60% in Asia.
Azenta AZTA 2021 104. 5.29 .0507 3,936 TBD Around 2021, 'Azenta' was spun off from 'Brooks Automation'.
Badger Meter Inc BMI 2022 112. 3.94 .0352 TBD TBD TBD
Badger Meter Inc BMI 2019 45. 1.66 .0367 1,567 TBD TBD
Balchem Corp BCPC 2019 70. 3.81 .0542 1,424 TBD TBD
Barrett Business Services BBSI 2021 29. 3.01 .103 121,660 TBD TBD
BCE Inc (Bell Canada) BCE 2019 TBD TBD TBD 52,100 TBD A Canadian company.
Becton Dickinson BDX 2021 367. 14.2 .0387 70,000 TBD TBD
Berkshire Hathaway BRK-B 2019 6. .374 .0657 391,500 TBD This CEO compensation for Warren Buffet is ridiculously low. He is pulling the SEC's leg. Not funny, Warren. Better to use a Vice-Chairman 19.0 million compensation --- giving a 289 pay ratio. See the proxy statment for details.
Best Buy Inc BBY 2019 438. 11.8 .0270 127,688 112,791 In addition to U.S. employees, Best Buy has employees in Canada, China, and Mexico.
Black Hills Corp BKH 2021 40. 4.44 .109 2,884 TBD TBD
Bright Horizons Family Solutions Inc BFAM 2019 77. 1.89 .0247 33,096 22,273 Non-U.S. employees were in the U.K., Netherlands, India, Canada.
Bristol-Meyers Squibb BMY 2019 152. 18.7 .123 30,000 TBD TBD
Broadcom Inc AVGO 2019 160. 26.9 .168 19,000 TBD See the proxy statement for the handling of multi-year awards.
Bruker Corp BRKR 2019 64. 4.91 .0764 7,230 TBD TBD
Burlington Stores BURL 2019 3030. 35.1 .01158 44,000 TBD TBD
Cadence Design Systems CDNS 2021 102. 11.1 .109 9,300 TBD TBD
Calavo Growers CVGW 2022 208. 3.22 .0154 4,870 2,386 51% of the employees were from Mexico. The remaining from the U.S. The median employee was in Mexico. Pesos were converted to dollars using the average published interbank exchange rate of 20.01 pesos per US dollar during fiscal 2022.
Calavo Growers CVGW 2019 523. 2.59 .00495 5,619 TBD 55% of the employees were from Mexico. The remaining from the U.S.
California Resources CRC 2021 119. 17.5 .148 970 TBD TBD
California Water Service Group CWT 2019 85. 13.3 .156 1,202 TBD Median employee compensation seems high.
Canadian National Railway CNI 2021 TBD TBD TBD 22,604 TBD A Canadian company.
Canadian Pacific Railway CP 2021 TBD TBD TBD 11,834 TBD A Canadian company that bought Kansas City railway circa 2022.
Carrier Global CARR 2021 224. 14.8 .663 58,000 TBD TBD
Cass Information Systems CASS 2021 46.7 2.36 .0506 1,063 TBD TBD
CDW Corp CDW 2019 66. 6.19 .0934 8,750 TBD TBD
Centerpoint Energy CNP 2019 75. 7.72 .103 7,900 7,900 TBD
Chemed Corp CHE 2019 226. 10.0 .0444 16,639 TBD TBD
Chesapeake Utilities CPK 2021 35. 2.82 .0799 1,007 TBD TBD
Chevron Corp CVX 2021 12. 22.6 1.83 42,595 TBD Median employee compensation looks suspiciously high.
Chubb Limited CB 2019 309. 20.5 .0664 33,000 TBD The employees are in 54 countries and territories.
Cincinnati Financial CINF 2019 58. 5.52 .0961 5,200 5,150 TBD
Cintas Corp CTAS 2022 146. 7.77 .0533 40,000 TBD TBD
CME Group CME 2021 150. 22.9 .153 3,480 2,230 TBD
CMS Energy Corp CMS 2019 73. 8.99 .122 8,789 TBD TBD
Cognex Corp CGNX 2021 119. 10.5 .0887 2,253 924 TBD
Colgate-Palmolive Co CL 2021 382. 15.4 .0404 33,800 TBD TBD
Conagra Brands Inc CAG 2022 206. 11.9 .0578 18,600 TBD TBD
Consolidated Edison ED 2021 78. 10.3 .132 13,871 TBD The median employee compensation seems high.
Constellation Brands STZ 2021 338. 12.0 .0356 9,300 TBD TBD
Constellation Brands STZ 2019 192. 10.3 .0538 TBD TBD The compensation paid to non-US employees in local currency was converted to US dollars "using the applicable exchange rate in effect as of the determination date."
The Cooper Companies COO 2021 305. 10.9 .0361 12,000 TBD TBD
Copart Inc CPRT 2021 14. .490 .0356 8,600 TBD TBD
Corning Inc GLW 2019 291. 14.3 .0491 50,155 TBD Employees are in 37 countries.
Costar Group CSGP 2019 215. 19.3 .0899 4,340 TBD Costar had about 141 employees in Germany, Spain, China, Singapore, France, Colombia, Australia, and United Arab Emirates.
Costco Wholesale COST 2021 193. 8.75 .0453 285,000 188,000 When Costco did not include part-time, seasonal and temporary workers in the calculations, the 'median employee' pay was $58,161 = $0.0581 million - which yielded a CEO-pay-ratio of 150 in 2021.
Costco Wholesale COST 2018 191. 7.40 .0388 239,300 156,900 Non-US employees compensation was converted to US dollars using an average exchange-rate.
CSX Corp CSX 2019 144. 15.5 .107 20,497 TBD The median employee compensation included $21,765 in health care benefits for the employee and eligible dependents in addition to $85,867 in base salary, wages, and overtime pay.
Coterra Energy Inc CTRA TBD 131. 11.9 .0914 TBD TBD Cabot Oil & Gas (COG) merged with Cimarex Energy (XEC) in 2021. Cimarex Energy merged with Coterra Energy
Cummins CMI 2021 290. 15.6 .0538 59,900 TBD TBD
Darden Restaurants DRI 2022 542. 11.9 .0219 160,000 TBD TBD
Deere DE 2021 242. 19.9 .0822 75,600 TBD TBD
Delta Air Lines DAL 2019 147. 17.3 .118 99,000 96,000 TBD
Deutsche Telekom AG DTEGY 2021 TBD TBD TBD 217,000 TBD A German company.
Diamondback Energy FANG 2019 116. 16.0 .138 712 TBD TBD
Dollar General DG 2021 935. 16.6 .0178 153,024 152,901 Some employees were in non-U.S. jurisdictions such as Hong Kong (12), China (90), Mexico (20), and Turkey (1).
Dominion Energy D 2021 74. 8.16 .110 17,400 17,400 The reported CEO-pay-ratio was 119 in 2019. In 2019, a significant portion of the median employee's compensation came from 'change in pension value', $47,284.
Dorman Products Inc DORM 2021 70. 3.37 .0483 3,360 TBD TBD
DTE Energy DTE 2021 82. 11.1 .136 10,300 TBD TBD
Eagle Materials EXP 2022 86. 6.63 .0773 2,200 TBD TBD
Eastman Chemical Co EMN 2019 178. 14.5 .0816 15,180 11,230 TBD
Eaton Corp ETN 2021 344. 19.3 .0562 86,000 TBD Originally a U.S. company, but re-registered in Ireland.
Edison International EIX 2021 82. 14.4 .175 13,003 TBD Median employee compensation looks suspiciously high.
Edwards Lifesciences EW 2021 186. 13.6 .0730 15,700 TBD TBD
Essential Utilities WTRG 2021 51. 5.34 .105 3,211 TBD 'Essential Utilities' was 'Aqua America' until it merged with a gas company.
Estee Lauder Co EL 2021 1965. 65.9 .0335 62,000 TBD TBD
Eversource Energy ES 2021 50. 6.66 .133 9,227 TBD Median employee compensation looks like it may be 'boosted' somewhat.
Exact Sciences Corp EXAS 2021 114. 14.6 .128 6,500 TBD TBD
Exelon EXC 2021 98. 15.7 .160 31,518 TBD Median employee compensation looks like it may have been 'boosted' somewhat.
Expedia Group EXPE 2019 161. 11.2 .0698 22,152 10,227 TBD
Exponent Inc EXPO 2019 19. 2.61 .138 1,201 TBD TBD
ExxonMobil XOM 2021 125. 23.6 .189 63,000 TBD Median employee compensation looks suspiciously high?
Fair Isaac International FICO 2021 216. 19.4 .0900 3,650 TBD TBD
Fastenal Co FAST 2022 122. 5.43 .0447 TBD TBD Fastenal used the median employee identified in 2020 for 2022.
Fastenal Co FAST 2021 59. 2.42 .0408 20,479 16,949 TBD
Fedex Corp FDX 2022 271. 10.6 .0391 289,000 TBD TBD
Ferguson PLC FERGY 2021 TBD TBD TBD 31,924 TBD 'Ferguson' was previously named 'Wolseley' headquartered in England.
Fidelity National Information Services FIS 2019 467. 27.6 .0592 55,000 TBD If a one-time CEO bonus for the Worldpay acquisition were excluded, the ratio would be 315.
Franklin Electric FELE 2022 266. 6.70 .0251 5,116 TBD The median employee used was an administrative employee in a Franklin Electric manufacturing facility in South Africa.
Franklin Electric FELE 2021 312. 6.89 .0221 5,116 TBD TBD
Gamestop Corp GME 2021 1354. 16.8 .0124 12,000 TBD TBD
Garmin Ltd GRMN 2019 92. 3.23 .0352 15,000 TBD The median employee was located in the United Kingdom.
General Electric GE 2019 486. 24.6 .0505 211,000 69,000 TBD
Gentex Corp GNTX 2019 63. 3.06 .0484 5,800 TBD TBD
Gildan Activewear GIL 2021 TBD TBD TBD 44,000 TBD A Canadian company.
Global Payments GPN 2022 385. 22.2 .0578 25,314 TBD TBD
Global Payments GPN 2021 415. 23.3 .0562 24,333 TBD TBD
Graco Inc GGG 2021 89. 5.96 .0671 3,800 TBD TBD
Grainger, W. W. GWW 2021 138. 9.02 .0656 24,200 TBD TBD
Hasbro Inc HAS 2019 237. 17.9 .0757 5,877 TBD TBD
Hawaiian Electric Industries HE 2021 43. 5.93 .138 2,504 TBD The median compensation seems high --- apparently due to a $58K 'change in pension value' adjustment. Without it, the pay ratio is 53.
Heico Corp HEI 2019 170. 10.2 .0600 5,900 TBD TBD
Home Depot HD 2019 481. 10.9 .02265 415,700 369,400 TBD
Honda Motor Co HMC 2021 TBD TBD TBD 211,374 TBD A Japanese company.
Honeywell International HON 2019 295. 20.5 .0695 123,400 53,810 TBD
Hormel Foods HRL 2021 200. 9.95 .0497 20,000 TBD TBD
Humana Inc HUM 2019 227. 16.7 .0736 43,800 TBD The 48,800 employees include full-time, part-time, and seasonal 'associates'.
IAC/Interactive Corp IAC 2021 TBD TBD TBD 13,200 TBD Match was spun-off from IAC circa 2019.
Idacorp IDA 2021 39. 5.64 .145 2,000 TBD The CEO pay was "inclusive of the actuarial change in future pension benefits". The median employee pay included "overtime, premium and supplemental pay, non-equity incentive plan compensation, change in present value of pension benefits, and 401K match."
Idex Corp IEX 2019 137. 9.12 .0667 6,957 TBD Employees are in at least 25 countries.
Illinois Tool Works ITW 2019 298. 15.5 .0519 45,000 15,000 Employees are in 53 countries.
Ingersoll Rand Inc IR 2019 90. 5.54 .0615 6,656 TBD TBD
Innergex Renewable Energy INGXF 2019 TBD TBD TBD 410 TBD A Canadian company.
Innospec Inc IOSP 2021 114. 9.89 .0865 1,900 TBD TBD
Intel INTC 2019 695. 66.9 .0963 110,800 TBD If some one-time equity awards are excluded from the 2019 CEO compensation, the pay ratio becomes 208. In 2021, CEO Gelsinger's compensation was ridiculously high, $177.9 million.
Intelligent Systems (Corecard) CCRD 2021 TBD .754 TBD 800 TBD Intelligent Systems (INS) was renamed to Corecard (CCRD), circa 2022.
Inter Parfums Inc IPAR 2021 37. 2.60 .0696 467 TBD TBD
International Paper IP 2019 179. 15.9 .0888 50,442 TBD TBD
Intuit Inc INTU 2021 141. 24.9 .176 14,908 TBD The reported CEO-pay-ratio was 114 in 2019. Intuit has employees in the U.S., Canada, India, U.K., and several other countries.
Intuitive Surgical ISRG 2021 58. 8.06 .140 9,793 TBD TBD
Investors Title Co ITIC 2019 19. 1.25 .0653 402 TBD TBD
IPG Photonics Corp IPGP 2019 40. 1.25 .0312 5,960 TBD TBD
ITT Inc ITT 2021 122. 7.68 .0631 10,334 TBD The reported CEO-pay-ratio was 131 in 2019.
J & J Snack Food JJSF 2021 37. 1.49 .0398 4,300 TBD TBD
Jack Henry & Assoc. JKHY 2021 114. 8.69 .0764 6,714 TBD TBD
Johnson & Johnson JNJ 2021 297. 26.7 .0900 141,700 TBD TBD
Kaiser Aluminum Corp KALU 2019 70. 5.24 .0745 2,820 TBD TBD
Kansas City Southern KSU 2019 131. 6.38 .0486 7,100 3,000 Employees were in Mexico and the U.S. KSU was bought by Canadian Pacific circa 2022.
KB Home KBH 2019 135. 13.4 .0994 2,140 TBD TBD
Kinsale Capital Group KNSL 2019 20. 2.01 .101 251 TBD TBD
KLA Tencor Corp KLAC 2021 147. 13.7 .0931 11,550 TBD TBD
Koninklijke Philips ADR PHG 2021 TBD TBD TBD 78,189 TBD Headquartered in the Netherlands.
Kontoor Brands KTB 2021 1956. 9.97 .00510 14,000 TBD TBD
Lam Research LRCX 2021 120. 15.4 .129 14,100 TBD TBD
Lancaster Colony Co LANC 2021 92. 4.34 .0474 3,200 TBD TBD
LeMaitre Vascular LMAT 2021 28. 1.98 .0717 488 TBD TBD
Lennox International LII 2019 188. 13.2 .0705 11,420 TBD TBD
Lincoln Electric LECO 2021 191. 9.21 .0481 11,000 TBD TBD
Lockheed Martin Corp LMT 2021 164. 18.1 .110 114,000 TBD TBD
Logitech International S A LOGI 2021 222. 10.4 .0473 9,000 TBD Dual headquarters in Switzerland & California.
Louisiana Pacific LPX 2021 116. 9.43 .0813 4,800 TBD TBD
Lululemon Athletica LULU 2019 580. 11.3 .0194 15,700 TBD The median employee was a 'store associate' who worked on a part-time hourly basis during the fiscal year.
LyondellBassel Industries LYB 2019 184. 15.9 .0865 19,100 TBD TBD
L3Harris Technologies LHX 2021 142. 15.6 .110 47,000 TBD TBD
Marathon Oil MRO 2021 102. 12.9 .128 1,531 TBD Median employee compensation may have been 'boosted' some?
Marathon Petroleum MPC 2021 142. 21.1 .148 1,531 TBD Marathon Petroleum was spun off from Marathon Oil, circa 2015. Median employee compensation may have been 'boosted' some?
Marketaxess Holdings MKTX 2019 27. 3.84 .140 527 TBD Median employee compensation may have been 'boosted' some?
Marriott International MAR 2019 346. 13.4 .0388 174,000 TBD TBD
Marten Transport MRTN 2021 23. 1.42 .0603 4,007 TBD TBD
Masimo Corp MASI 2019 127. 15.0 .118 1,420 983 TBD
Mastercard MA 2019 168 23.2 .138 18,600 TBD TBD
Match Group Inc MTCH 2021 238. 25.3 .106 2,540 TBD Match Group was spun off from IAC/Interactive Corp.
Maxim Integrated Products MXIM 2020 188. 7.30 .0388 TBD TBD TBD
MAXIMUS Inc MMS 2021 208. 7.90 .0380 35,800 TBD Was acquired by Analog Devices Inc in Aug 2021.
McDonald's Corp MCD 2019 1939. 18.01 .00929 205,000 TBD The median employee was a part-tme restaurant crew member in the U.K.
MDU Resources MDU 2019 96. 6.14 .0637 13,359 TBD TBD
MercadoLibre Inc MELI 2019 660. 11.5 .0174 3,492 TBD Most of the employees are in Mexico and South American countries where the monthly minimum wage is almost 10 times lower than in the U.S.
Merck & Co Inc MRK 2019 289. 27.6 .0956 73,900 25,840 TBD
Mesa Labs Inc MLAB 2022 270. 17.3 .0641 506 TBD TBD
Methanex Corp MEOH 2019 TBD 5.9 TBD 1,300 TBD A Canadian corporation.
Mettler Toledo International MTD 2019 222. 8.75 .0394 16,200 TBD Employees are in the U.S., Canada, China, and Europe.
MGE Energy MGEE 2021 22.6 2.63 .116 706 TBD TBD
MGP Ingredients Inc MGPI 2019 21. 1.57 .0764 341 TBD TBD
Microchip Technology MCHP 2022 275. 12.7 .0463 19,500 TBD TBD
Microsoft MSFT 2021 282. 49.8 .176 181,000 TBD TBD
Monolithic Power Systems MPWR 2019 254. 9.36 .0368 2,002 TBD The median employee was located in China.
Monster Beverage Corp MNST 2019 253. 13.9 .0551 3,529 TBD TBD
Motorola Solutions MSI 2019 252. 23.6 .0937 17,536 TBD The employees are in 58 countries.
National Beverage Co FIZZ 2022 TBD 11.1 TBD 1,550 TBD TBD
National Fuel Gas NFG 2021 82. 6.95 .0847 2,188 TBD TBD
NextEra Energy NEE 2021 191. 25.3 .132 9,700 TBD Median employee compensation may have been 'boosted' some?
Nice Ltd ADR NICE 2021 TBD TBD TBD 7,102 TBD Nice Ltd is an Israeli company.
Nike Inc NKE 2022 771. 28.8 .0374 73,300 TBD TBD
Nordic American Tankers NAT 2020 TBD TBD TBD 20 TBD NAT is a Norwegian company.
Nordson Corp NDSN 2021 157. 10.3 .0655 6,813 TBD TBD
Norfolk Southern Railway Corp NSC 2021 140. 14.0 .0999 18,100 TBD The reported CEO-pay-ratio was 154 in 2019.
Northland Power Inc NPIFF TBD TBD TBD TBD TBD TBD Northland Power is a Canadian company.
Northrop Grumman Co NOC 2019 177. 20.3 .115 90,000 TBD TBD
Northwest Natural Holding Co NWN TBD 33. 3.75 .113 TBD TBD TBD
Nucor NUE 2019 218. 19.1 .0875 25,322 22,672 TBD
Nvidia Corp NVDA 2019 64. 11.5 .179 13,277 TBD TBD
Occidental Petroleum OXY 2021 71. 11.0 .157 11,678 TBD Median employee compensation may have been 'boosted' some?
Old Dominion Freight Line ODFL 2019 90. 7.34 .0815 20,105 TBD TBD
Omega Flex Inc OFLX 2019 36. 2.37 .0650 151 TBD The 2019 median employee was a full-time hourly employee located on the Exton, Pennsylvania facility.
Orange S. A. ORAN 2021 TBD TBD TBD 139,698 TBD 'Orange' was formerly 'France Telecom'.
Ormat Technologies ORA 2019 25. 1.66 .0657 1,408 TBD Ormat is an Israeli-headquartered international company.
Otter Tail OTTR 2021 67. 4.73 .0705 2,487 TBD TBD
Packaging Corp of America PKG 2019 144. 10.3 .0712 14,600 14,560 About 40 employees are in Canada and Hong Kong.
Parker Hannifin PH 2021 303. 17.0 .0562 54,640 TBD TBD
Paychex Inc PAYX 2022 194. 11.0 .0569 15,000 TBD TBD
Paycom Software Inc PAYC 2019 328. 21.1 .0644 3,765 TBD TBD
PC Connection CNXN 2019 60. 4.03 .0675 2,609 TBD TBD
Pentair PLC PNR 2019 108. 6.41 .0592 9,360 TBD TBD
Perspecta Inc PRSP 2020 83. 6.38 .0772 TBD TBD Perspecta was bought by private-equity firm Veritas Capital in May 2021.
Phillips 66 PSX 2021 130. 20.9 .161 7,110 TBD Median employee compensation may have been 'boosted' some?
Pinnacle West Capital PNW 2021 59. 8.10 .136 5,872 5,872 The reported CEO-pay-ratio was 90 in 2019. The employee total was 6,303.
PNM Resources Inc PNM 2021 44. 5.59 .128 1,600 TBD CEO compensation included items like payments for personal security & executive physicals.
PNM Resources Inc PNM 2020 76. 8.96 .118 TBD TBD CEO & median-employee compensation included bonuses, awards, insurance premiums & benefits like post-retirement medical plans.
Pool Corp POOL 2019 66. 3.29 .0501 4,200 TBD Employees in at least 5 different countries.
Portland General Electric POR 2019 33. 4.07 .122 2,949 TBD TBD
Power Integrations POWI 2021 63. 6.56 .104 773 TBD The reported CEO-pay-ratio was 51 in 2019.
PPL Corp PPL 2019 96. 14.1 .147 12,355 TBD The median employee compensation seems high --- probably because 'change in pension value' was added in.
Pricesmart Inc PSMT 2021 914. 7.55 .00826 10,400 TBD Most employees are located outside the U.S. The Pricesmart 'median employee' in 2021 was a full-time cashier in a Costa Rica warehouse club.
Procter & Gamble PG 2022 273. 18.0 .0659 101,000 TBD TBD
Progressive Corp PGR 2021 220. 14.5 .0659 49,000 TBD TBD
Public Service Enterprise Group PEG 2019 92. 13.1 .142 12,992 TBD TBD
Qualcomm Inc QCOM 2019 256. 23.1 .0902 37,000 TBD TBD
Qualcomm Inc QCOM 2018 233. 19.9 .0855 35,400 TBD The 35,400 employees were located in 36 countries, "representing full-time, part-time, seasonal and temporary workers as of the Determination Date." The number does not include independent contractors or "leased" workers.
Quanex Building Products NX 2019 69. 2.93 .0426 3,818 TBD There are employees in the U.K. and Germany.
Raytheon Technologies RTX 2021 208. 23.3 .112 174,000 TBD Raytheon acquired the defense/aerospace parts of United Technologies, circa 2020.
RBC Bearings Inc RBC 2022 300. 19.3 .0646 3,885 TBD RBC = Roller Bearings Corp? Stock symbol was ROLL before 2022.
Republic Services RSG 2021 125. 8.55 .0682 35,000 TBD The reported CEO-pay-ration was 197 in 2019.
Resmed Inc RMD 2021 154. 10.3 .0676 7,970 TBD TBD
Rockwell Automation ROK 2019 202. 11.7 .0579 23,000 13,800 About 60% of the employees were located outside of the U.S. in Sept 2019.
Rocky Brands Inc RCKY 2021 TBD .475 TBD 2,825 TBD TBD
Rogers Communications Inc RCI 2021 TBD TBD TBD 23,000 TBD Rogers Communications is a Canadian company.
Roku Inc ROKU 2021 69. 18.1 .262 3,000 TBD Median employee compensation seems unexpectedly high.
Roper Technologies ROP 2019 212. 18.8 .0889 15,849 TBD Some 2019 employees were in Germany (263), France (163), and the Czech Republic (6).
Ross Stores Inc ROST 2019 1059. 12.02 .01135 88,100 TBD The median employee worked in a retail store on a part-time hourly basis.
Sanfilippo, John B. & Son JBSS 2021 29. 1.77 .0617 1,300 TBD TBD
Seagate Technology STX 2022 1227. 13.2 .0107 40,000 TBD TBD
Seagen (Seattle Genetics) SGEN 2021 76. 18.9 .250 2,675 TBD TBD
Servicemaster Global SERV 2019 109. 5.26 .0481 TBD TBD Servicemaster Brands went private when it was purchased by Roark Capital Group in Oct 2020.
Sherwin Williams Co SHW 2019 349. 14.8 .0425 TBD TBD There were employees in 58 countries --- 46,951 full-time and 13,291 part-time.
Sherwin Williams Co SHW 2018 311. 13.2 .0424 60,242 TBD A Canadian employee was the median employee. A simple average of the monthly local currency exchange rates was used to convert Canadian dollars to US dollars for the applicable period.
Silicom Ltd SILC 2020 TBD TBD TBD 127 TBD Silicom is an Israeli company.
Simpson Manufacturing SSD 2021 63. 3.91 .0624 3,971 TBD TBD
SJW Group SJW 2019 32. 2.61 .0820 500 TBD SJW = San Jose Water
Skyworks Solutions Inc SWKS 2021 928. 16.1 .0161 11,000 2,530 TBD
Solaredge Technology SEDG 2019 24. 2.08 .0872 2,431 TBD Solaredge is headquartered in Israel.
Southern Copper SCCO 2021 TBD TBD TBD 14,700 TBD Southern Copper is headquartered in Mexico.
Southwest Gas Holdings SWX 2022 52. 4.46 .0869 TBD TBD TBD
Southwest Gas Holdings SWX 2021 49. 5.67 .115 2,286 TBD TBD
Starbucks Corp SBUX 2021 TBD TBD TBD 138,000 TBD TBD
Stryker Corp SYK 2019 212. 15.0 .0708 36,800 TBD TBD
SunPower SPWR 2021 111. 8.94 .0804 3,660 TBD The reported CEO-pay-ratio was 205 in 2019. The 'median employee' in 2019 was a full-time, hourly employee located in Mexico. The 'median employee' in 2021 was a full-time, hourly employee, who became a salaried employee prior to year-end, located in the U.S. The employee total in 2019 was 8,400, before the spin-off of 'Maxeon'.
Synopsys Inc SNPS 2019 108. 9.63 .0891 13,683 TBD TBD
Sysco Corp SYY 2021 309. 23.2 .0752 58,000 TBD TBD
Target Corp TGT 2019 821. 18.9 .0230 360,000 TBD The median 'team member' was employed part-time.
Target Corp TGT 2017 408. 8.40 .0205 TBD TBD TBD
TC Energy TRP 2021 TBD TBD TBD 7,017 TBD 'TC Energy' was formerly named 'TransCanada Pipelines', thus symbol TRP.
TE Connectivity Ltd TEL 2019 446. 9.29 .0208 70,588 10,162 TBD
Teck Resources TECK 2021 TBD TBD TBD 10,600 TBD Teck Resources is a Canadian mining company.
Teleflex Inc TFX 2019 146. 6.78 .0466 14,116 3,609 There are employees in at least 22 countries.
Telefonica Brasil S A VIV 2021 TBD TBD TBD 33,985 TBD Telefonica Brasil is clearly a Brazilian company.
Telus Corp TU 2021 TBD TBD TBD 90,800 TBD Telus is a Canadian telecom company.
Teradyne Inc TER 2019 82. 8.00 .0971 5,400 TBD TBD
Texas Instruments TXN 2021 277. 19.2 .0694 29,568 TBD TBD
Thermo Fisher Scientific TMO 2019 235. 19.0 .0809 75,000 TBD TBD
Timken TKR 2019 229. 11.9 .0519 16,947 TBD TBD
Toro Co TTC 2021 182. 8.62 .0474 9,520 TBD TBD
Total S. A. TTE TBD TBD TBD TBD TBD TBD Total is a French oil & energy company. It changed its name to TotalEnergies SE circa 2021 & its stock symbol from TOT to TTE.
Trane Technologies TT 2019 442. 24.2 .0547 46,763 27,280 TBD
Travelers Companies TRV 2019 151. 16.8 .111 30,800 TBD TBD
Trex Co Inc TREX 2019 41. 2.77 .0682 1,332 1,321 Employees were in 6 countries.
Trinity Industries TRN 2021 356. 5.57 .0156 2,000 TBD TBD
T. Rowe Price TROW 2021 124. 17.1 .138 7,529 TBD TBD
Tyler Technologies TYL 2019 48. 4.19 .0875 5,219 TBD TBD
Ulta Beauty Inc ULTA 2019 419. 7.06 .0168 49,612 TBD This median employee compensation calculation included seasonal and temporary employees hired during the 4th quarter holiday season.
Union Pacific Corp UNP 2021 162. 14.5 .0899 34,500 TBD The reported CEO-pay-ratio was 189 in 2019. There were about 42,800 employees in 2019.
Union Pacific Corp UNP 2020 168. 16.6 .0991 37,700 TBD The reported CEO-pay-ratio was 189 in 2019. There were about 42,800 employees in 2019.
United Parcel Service UPS 2019 243. 18.0 .0743 466,700 TBD TBD
United States Lime & Minerals USLM 2021 51. 3.59 .0708 308 TBD TBD
UnitedHealth Group UNH 2021 301. 18.4 .0613 333,499 220,056 TBD
UnitedHealth Group UNH 2019 348. 18.9 .0543 320,560 207,115 TBD
Unitil Corp UTL 2021 23. 2.43 .104 508 TBD TBD
Universal Display Corp OLED 2021 74. 10.5 .142 409 TBD The median employee compensation is unusually high because of engineer salaries??
Utah Medical Products UTMD 2021 14. .494 .0353 211 TBD TBD
Valero Energy Corp VLO 2019 103. 28.2 .272 10,225 TBD The median EMPLOYEE compensation is 'jacked up' due to a $109,770 'change in pension value'. Without that, the ratio would be 174.
Verisign Inc VRSN 2019 50. 9.02 .180 872 TBD Even for a technology company, this median employee compensation seems high.
Verisk Analytics Inc VRSK 2019 117. 9.05 .0771 7,304 5,258 Employees were in at least 25 countries.
Verizon VZ 2021 166. 20.4 .122 118,400 TBD The compensation of the median employee was 'jacked up' by "the estimated present value of the employee's accrual under a Verizon pension plan" and "the estimated amount of Verizon's contributions for that period to the retirement plans in which the employee participates".
Vertex Pharmaceuticals VRTX 2021 65. 15.2 .234 3,388 TBD The median emplyee compensation seems quite high --- especially considering many employees were overseas in 20 countries, many with lower-average-income than in the United States. Vertex officers are trustworthy?
VF Corp VFC 2022 576. 15.4 .0267 40,000 TBD TBD
VF Corp VFC 2019 1,767. 17.8 .0101 62,799 24,352 The employees were located in more than 57 countries. The median employee was a part-time US-based retail associate. The VF Corp workforce consisted in the US of many part-time college or high school students and, internationally, many manufacturing & production based employees.
Visa Inc V 2021 211. 30.9 .146 21,500 TBD TBD
Vulcan Materials VMC 2019 112. 9.57 .0856 9,175 8,762 The employees were in the U.S. and Mexico.
Wabash National Corp WNC 2019 72. 4.41 .0613 6,748 TBD TBD
Walmart Inc WMT 2021 1,013. 25.6 .0253 2,234,015 TBD TBD
Walmart Inc WMT 2019 983. 22.1 .0225 2,234,894 TBD TBD
Waste Connections Inc WCN 2019 62. 3.41 .0554 18,261 15,323 Waste Connections is headquartered in Texas but serves Canada as well as USA. But its 'tax headquarters' are in Canada.
Waste Management WM 2021 162. 13.1 .0807 48,687 46,593 The median employee was a driver in the U.S.
Waters Corp WAT 2019 15. 1.08 .0747 6,738 2,736 TBD
WD-40 Corp WDFC 2021 47. 4.39 .0935 540 TBD TBD
WEC Energy WEC 2021 151. 18.5 .122 6,938 TBD TBD
West Pharmaceutical Services WST 2019 132. 6.48 .0492 7,881 3,421 TBD
Winmark Corp WINA 2019 12. .881 .0788 98 TBD TBD
Woodward Inc WWD 2021 92. 5.61 .0606 7,200 TBD TBD
Xcel Energy XEL 2021 95. 11.6 .122 11,321 TBD Median employee compensation looks rather high. Hazard pay??
Xilinx Inc XLNX TBD 105. 14.6 .139 TBD TBD Acquired by AMD in Feb 2022. Rather high median employee compensation because of many engineers with salaries above $130K ??
York Water Co YORW 2021 TBD .429 TBD 110 TBD TBD
Yum! Brands Inc YUM 2019 1413. 16.4 .0116 32,076 16,480 TBD
Zoetis Inc ZTS 2021 161. 13.0 .814 12,100 TBD TBD
3M Corp MMM 2019 319. 18.3 .0575 90,823 TBD TBD
Company Name Stock
Info
Year
of the Data
CEO
Pay Ratio
CEO Comp.
($million)
Median Comp.
($million)
Approx. Total
Employees
Approx. U.S.
Employees
Notes

Some Observations about the CEO Pay Ratios above:

The CEO Pay Ratios can range from about 10 to over 1,000.

Typically you will see lower CEO Pay Ratios for technology companies where there are a lot of relatively-highly-paid engineers & computer scientists & medical scientists.

Typically you will see higher CEO Pay Ratios for fast-food companies where there are a lot of hourly and temporary and seasonal employees who make little more than the U.S. federal minimum wage.

Another type of company where you will see higher CEO Pay Ratios is companies with a lot of foreign workers in countries like Mexico --- where most of the workers are being paid less than $15,000 per year (converted to U.S. dollars).


Some NOTES on the CEO compensation numbers:

CEO compensation numbers reported often do NOT include change in pension value and 'non-qualified deferred compensation earnings'.

The pensions for CEO's of large companies are often 'golden parachutes' that amount to 10's of millions of dollars.

Furthermore, 'deferred' compensation often amounts to millions of dollars.

Therefore, the CEO compensation figures in the table above typically do not take into account many millions of dollars that may be added to a CEO's compensation in future years.


In some years, there is a transition from one CEO to another. In those years, it is frequently the case that the former CEO and the new CEO are BOTH being compensated approximately equally --- and quite 'handsomely'.

And in some years, due to unusual circumstances, an NEO (such as the Chief Financial Officer) may receive greater compensation than the CEO.

In cases where the CEO is reporting 'unbelievably' low compensation, the compensation of the most highly compensated NEO may be used for the 'CEO-compensation' figure.


Since there are usually about 4 to 7 NEO's in addition to the CEO --- and because their compensation is typically about one-third (or more) of the CEO compensation, the total compensation for all the NEO's (including the CEO) is typically at least   (1 + 4*1/3) = 2.33   TO   (1 + 7*1/3) = 3.33   times the CEO compensation.

Therefore, by tripling the CEO compensation, you can get a rough idea of the total compensation going to all the NEO's.


In some very large companies (like Amazon and Facebook/Meta), the CEO compensation (of Jeff Bezos and Mark Zuckerberg) looks ridiculously low compared to the compensation of other NEO's of the company.

It may look like the CEO is NOT being compensated enough, but, in those cases, the CEO is typically 'making a killing' on the appreciation of the stock they own. And in some cases, the CEO had huge reported compensation in a previous year (s).

Note that, nowadays, U.S. proxy statements have a 'CEO pay ratio' section --- which reports the CEO compensation and the 'median' compensation of the company employees --- and the ratio of those two dollar amounts.

Circa 2020, the 'CEO pay ratio' is/was typically about 300 in large companies --- with some in the 1000's.

In the case of Amazon and Berkshire-Hathaway --- and in other companies which report unusually low compensation for the CEO --- if the 'true' CEO compensation were reported in the 'Summary of Executive Compensation' in proxy statements, the 'CEO pay ratio' would probably be in the 1000's --- or ten thousands.


In many cases, CEO compensation goes up about 30% or more in one year if the company has good results --- BUT CEO compensation typically goes down only about 10% (if at all) when the company does poorly.

Sometimes when a company does poorly, it is out of control of the CEO. On the other hand, when a company has a very good year, it is often due to beneficial market forces that were not the result of any actions of the CEO.

In any case, the result of 'more up than down' is a quite rapid upward climb in CEO compensation that is FAR FAR beyond the rise in the Consumer Price Index (CPI) over the years --- thus widening the 'income gap' at a disturbing rate.

In short:
Pay incentives based on CEO performance seem to weighted more to the 'additive' side than the 'subtractive'.


The 'top-one-percent' is unrelenting in flooding media outlets with the message that certain politicians want 'redistribution of wealth' --- meaning don't raise our taxes and don't close our tax loopholes, among other things --- like give us more tax breaks, it'll 'trickle down'.

This draws attention away from the fact that the federal-minimum-wage stays fixed for a decade or more --- and the 'income gap' widens rapidly in favor of the 'top-one-percent'.

It seems that many 'bottom-50-percenters' (who can't take advantage of tax loopholes) are buying that message --- or other messages (immigration, gun control, abortion) that distract from the 'pay inequities' issues.

Just goes to show that daily, repetitive propaganda works.


Some NOTES on 'median employee' compensation numbers:

Some companies include 'change in pension benefits' in the computation of the compensation of their 'median employee' --- and use a 'present value' of that figure.

It seems that water utility companies like to do this --- and their 'median employee' is thus making about $150,000 per year.

I really doubt that their median employee was making $150,000 per year in 2019.

Because of situations like this, 'CEO pay ratios' are not suited for comparisons of CEO pay between different companies --- because some companies are 'fudging' the compensation figures.

In fact, many of the companies include a statement like the following when they report their 'CEO Pay Ratio'.

    "We believe our pay ratio presented above is a reasonable estimate. As SEC rules for identifying the median employee and calculating the pay ratio allow companies to use different methodologies, estimates and assumptions, our pay ratio may not be comparable with the pay ratios reported by other companies. Furthermore, the SEC has stated that it did not believe a purpose of the pay ratio was to facilitate comparisons among companies."
    - from Mastercard

    "The pay ratio disclosure set forth above is a reasonable estimate calculated in a manner consistent with applicable SEC rules, based on the methodologies and assumptions described above. SEC rules for identifying the median employee and determining the related pay ratio permit companies to use a wide range of methodologies, estimates and assumptions. As a result, the pay ratios reported by other companies may be based on other permitted methodologies and/or assumptions, and as a result, are likely not comparable to our pay ratio."
    - from Expedia Group

    "The pay ratio represents our reasonable estimate calculated in a manner consistent with Item 402(u) of Regulation S-K and applicable guidance, which provide significant flexibility in how companies identify the median employee. Each company may use a different methodology and make different assumptions. As a result, and as explained by the SEC when it adopted these rules, in considering the pay ratio disclosure, stockholders should keep in mind that the rule was not designed to facilitate comparisons of pay ratios among different companies, even companies within the same industry, but rather to allow stockholders to better understand and assess each particular company's compensation practices and pay ratio disclosures. Neither the [company] Compensation Commission nor our management used our ... CEO to median employee pay ratio in making compensation decisions."
    - from Nvidia

To compare CEO compensation growth from company to company, you could try the CEO Compensation and Company Revenues page of this site.

That page looks at 'velocity' & 'acceleration' of CEO compensation in about 250-plus different companies --- facilitating a focus on comparing CEO compensation rates-of-change of various companies, rather than consideration of executive-compensation compared to compensation of a 'median employee'.


NOTE that, in 'absolute' numbers rather than 'percentage' numbers, the 'median employee' compensation is generally going up no more than a few thousand dollars per year --- while CEO compensation is (for many, many companies) going up several HUNDRED thousand dollars per year --- and in some years jumping up by millions of dollars per year.

In short:
The CEO compensation increases (for many, many companies) are going up about 100 to 1,000 times faster than compensation for the vast majority of the employees.

It seems that this is 'unsustainable'. In other words, it seems almost inevitable that, unless there is major change, this can only 'end badly'. (Eventually NEO compensation would eat up all the profits of the company --- and employees would, justifiably, feel de-valued.)

Some LINKS for more information

Some more information on these companies may be available at their web sites --- and their 10-K reports may be available at the SEC web site at sec.gov, where SEC = Securities and Exchange Commission. However, it may not be easy to find annual reports and proxy statements for a given company on their site.

The site docoh.com provides SEC filings (such as 10-K annual reports and proxy statements, which include executive compensation data) in convenient lists of links to relevant documents. (You can use the 'Search' field at the top of the home page. Enter a stock symbol or company name. The '10-K' annual reports and 'DEF 14A' annual proxy statements are readily available.)

    NOTE:
    'docoh.com' became 'capedge.com' circa 2022.

    To avoid getting too many unwanted search results at 'capedge.com', enter a stock-symbol rather than a company-name (for example, 'ge' rather than 'general electric' & 'fast' rather than 'fastenal').


The site salary.com is a good source of executive compensation for any given company --- for multiple years for various NEO's of the company.

You can enter a company name in the 'Search' field of the web page at

www.salary.com / personal / executive-salaries/

and get a breakdown of compensation of the NEO's into

  • salary
  • bonus
  • stock options
  • stock awards
  • other

CEO-pay-ratio data is reported below the list of compensation figures for the NEO's --- on the 'salary.com' company pages.


The site macrotrends.net is a good source of revenues data (and 'gross profit' and 'operating income' and 'net income') for any given company --- for multiple years on one web page per company.

You can enter a company name or stock symbol --- such as AAPL --- in the 'Search' field of the web page at

www.macrotrends.net / stocks / research

and, in a drop-down menu, of options such as

  • Apple (AAPL) - Revenue
  • Apple (AAPL) - Gross Profit
  • Apple (AAPL) - Operating Income
  • Apple (AAPL) - Net Income
  • and about 6 others

you can choose the 'Revenue' line, and see a barchart of revenues over multiple recent years --- along with a summary of percent increase/decrease over the past few years.

Thus you can compare revenues (or other financial results) of a company against NEO compensation as seen at the 'salary.com' site.


Also, you can use the site macrotrends.net as a good source of number of employees 'trend' data for any given company --- for multiple years on one web page per company --- in a barchart.

As described above, you can choose the 'Revenue' line, and see a barchart of revenues over multiple recent years --- AND at the top of the 'Revenues' page is a set of 'tabs' with labels such as:

  • Prices
  • Financials
  • Revenue & Profit
  • Assets & Liabilities
  • Margins
  • Price Ratios
  • Other Ratios
  • Other Metrics

If you click on 'Other Metrics', you will see the two 'sub-tabs':

  • Dividend Yield History
  • Number of Employees

You can click on the 'Number of Employees' sub-tab, and see a barchart of the number of employees over multiple recent years --- along with a summary of percent increase/decrease over the past few years.

You can hold the cursor over any of the bars, in the number-of-employees barchart, to see a popup-box that shows the number of employees in that year.


Some sites may give slightly different values for compensation and revenues and other financial data in any given year.

Different sources may use different methods to arrive at various numeric data items. So it may behoove you to double-check the data using different data sources.

You can do various web searches on various companies to get further information on their pay-ratios and compensation (CEO and median employee).

For example, using Apple Inc. as a sample company, here are some example queries.

Additionally, you can get further information on many companies at Wikipedia --- for example, Alliant Energy (Wikipedia link).

You can use these WEB SEARCH and Wikipedia links, and change the company name for info on other companies.

Furthermore, there are many more links to financial information and charts on the Stock Price Histories web page of this site --- for about 800-plus companies.

By the way, you are welcome to take a copy of this page and add/change/correct data --- and/or re-organize the page as you wish --- and publish it on your own web site.

IN CONCLUSION:

Stockholders
(including institutions like pension funds
& ETF's & hedge funds):

VOTE THOSE PROXIES!

If you want to help put the brakes on the rapidly accelerating 'pay inequities', do not throw away those 'proxies' without voting them.

It is easy to vote via the internet. It just takes a small number of clicks or pokes at a 'proxy vote' web site.

In particular, almost every proxy includes a 'say on pay' item in the 'voting instruction form' --- worded something like this:

'Advisory vote to approve executive compensation.'

OR

'To approve, on a non-binding advisory basis, the compensation of the named executive officers.'

Typically you are offered the options: 'For', 'Against', or 'Abstain'.

Or the options: 'For' or 'Withold'.

If you think pay increases of 100's of thousands (or millions) of dollars per year are unwarranted (especially after a mediocre or bad year --- or series of years), then vote 'Against' or 'Withold'.

It is only 'advisory' --- but if enough people vote this way, mountains can be moved.

    By the way, those voting forms usually include a list of Board Directors to be elected or re-elected.

    Since the Directors are complicit in outlandish CEO and NEO compensation practices, if you vote 'Against'/'Withhold' on executive compensation --- to be consistent --- you should vote 'Against'/'Withhold' on election of Board Directors.

Bottom of this
CEO Pay Ratio
--- SORTABLE data
page.

To return to a previously visited web page location, click on the Back button of your web browser, a sufficient number of times.

OR, use the History-list option of your web browser.

OR ...

< Go to Top of Data Table, above. >

< Go to Top of Page, above. >

Page history:

Page was created 2020 Jun 10.

Page was changed 2020 Jun 15.
(Added a couple of company pay ratio 'disclaimers'. Added background colors to some table columns.)

Page was changed 2022 Apr 27.
(Changed many links in this page to open in a separate window or tab, so that this page remains available and so that the data in other windows are available for comparison.
Also, added or changed some text in the text sections at the top and bottom of this page.
NOTE: I still need to add some 'TBD' data missing from the table.)

Page was changed 2022 Apr 28.
(Added some text, in the bottom section of the page, describing how to use 'macrotrends.net' to show 'number of employees'.
Updated 2019 pay-ratio data with 2021 data, or replaced 'TBD', for about 50 companies.
Added table-rows for about 8 companies not reported before.
Used 'macrotrends.net' to replace 'TBD' for almost all the companies missing 'number of employees' data.)

Page was changed 2022 Oct 11.
(Added links at the top of this page to sections of the page.
Started adding links in the table for the Company-Name column & the CEO-pay-ratio column & the Total-Employees column.)

Page was changed 2022 Oct 14.
(Finished adding links in the table for the Company-Name column & the CEO-pay-ratio column & the Total-Employees column.
Started testing links in the table for the CEO-pay-ratio column & the Total-Employees column.)

Page was changed 2022 Oct 21.
(Finished testing links in the table for the CEO-pay-ratio column & the Total-Employees column.)

Page was changed 2022 Oct 27.
(CEO-compensation & Median-employee-compensation & CEO-pay-ratio were added to about 115 of the table-lines, i.e. companies, above.
These 3 types of data were added from the 'salary.com' web-site links above, rather than from hard-copies of proxy statements.)

Page was changed 2022 Oct 28.
(Added text to the various text sections of this page, for example, to add information on the links in the data table.)

Page was changed 2023 Apr 20.
(Added 17 company-lines to the data table. These 17 companies already had a year in the table, so these additions of a 2nd year for these companies provides a way to see how the CEO-pay-ratio may change from year to year.)