Deaths-versus-Age (2021)

(death-counts
versus
age-in-years)

'Peninsula' data


A Data Table for Plotting
a Distribution Profile

Home > RefInfo menu >

Diet and Medical Info menu >

Deaths-versus-Age Data MENU page >

This 'Deaths-versus-Age-Table (2021)' page

! Note !
I will probably not add any more data to this table.
I used all the obituary pages that I had collected
from Sunday issues of the Daily Press newspaper,
for the Virginia 'Peninsula' area.

However some additional images & information may be
added someday to show how the LibreOffice Calc
spreadsheet formulas and chart-dialogs were used.
That info may be added on this page --- or
on a 'central'/'parent' page.

Introduction to the table :

This page provides a table of 'number-of-deaths versus age' data --- for 'the Peninsula' --- for the year 2021.

The nature of the data collected is discussed on the 'parent page' of this page --- a 'menu-of-tables' page.

The data is presented below in a simple 'raw text' format --- so that it can be easily collected (copied and pasted) into a text file and fed into a plot utility.


#   Age       Count of      Count of
# (years)    MALE deaths   FEMALE deaths
#----------  -----------   -------------

less-than-1      0             0
  1              0             0
  2              0             0
  3              0             0
  4              0             0
  5              0             0
  6              0             0
  7              0             0
  8              0             0
  9              0             0
 10              0             0
 11              0             0
 12              0             0
 13              0             0
 14              0             1
 15              0             0
 16              1             0
 17              0             0
 18              1             0
 19              1             0
 20              0             0
 21              0             0
 22              0             0
 23              0             0
 24              1             0
 25              2             1
 26              0             0
 27              0             0
 28              0             0
 29              1             0
 30              0             3
 31              0             0
 32              1             0
 33              2             0
 34              0             1
 35              0             1
 36              1             2
 37              1             1
 38              0             1
 39              1             1
 40              3             0
 41              1             1
 42              2             1
 43              0             0
 44              0             3
 45              1             1
 46              0             1
 47              0             1
 48              0             3
 49              1             1
 50              1             1
 51              3             4
 52              3             2
 53              3             0
 54              4             3
 55              1             2
 56              5             2
 57              5             5
 58              9             3
 59              6             1
 60              9             2
 61             10             8
 62             11             8
 63              7             7
 64              6             4
 65              5             5
 66              5             9
 67             10             7
 68              6             7
 69              3             7
 70             14             5
 71              5            15
 72             12             7
 73             11             9
 74             13            13
 75             12            15
 76             15            12
 77             32            16
 78              8            18
 79             16            16
 80             22            13
 81             18            13
 82              8            11
 83             23            12
 84             18            15
 85             21            15
 86             15            18
 87             18            10
 88             17            25
 89             16            14
 90             10            13
 91             14            16
 92             14            14
 93             13            15
 94              5            15
 95              8            16
 96              4             9
 97              5             4
 98              3             8
 99              0             8
100              0             4
101              1             2
102              1             3
103              0             4
104              0             0
105              0             0
106              0             0
107              0             0
108              0             0
109              0             0
110              0             0
111              0             0
112              0             0


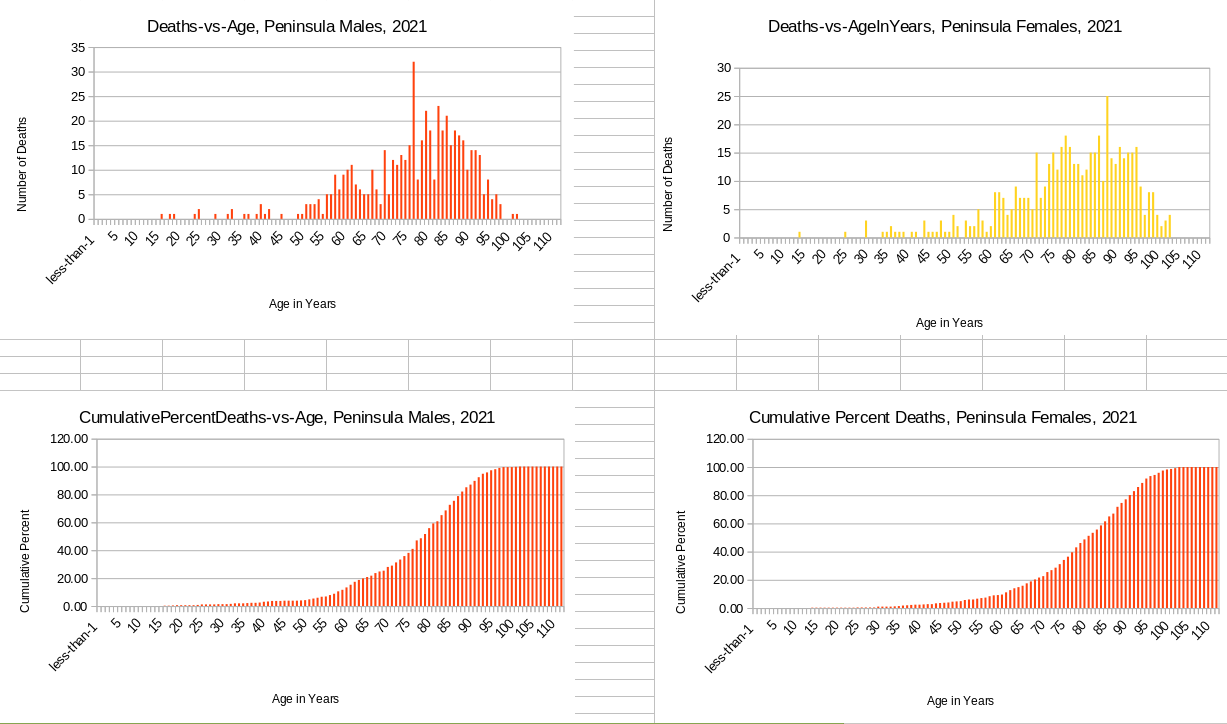
Sources of the data:

The 2021-data above was collected from Sunday obituary pages of the Daily Press newspaper (Wikipedia link).

This year-2021 data includes 525 men and 514 women --- a total of 1,039 deaths.

    Note that the data above is not a complete count of deaths on 'the Peninsula' --- an area between the James and York Rivers --- including the cities of Newport News and Hampton in the Hampton Roads area of Virginia (Wikipedia link).

The following Sunday obituaries were used --- 34 Sundays (quite a few less than 52 weeks of Sundays).

  • January - 3 10 17 24 31
  • February - 7 14 21
  • March - 7
  • April - 4 11
  • May - 9 16
  • June - 6 13
  • July - 4 18 25
  • August - 1 15 29
  • September - 5 12 19
  • October - 10 17 24 31
  • November - 7 14
  • December - 5 12 19 26


Click on this image to see it in
a separate web-browser window.

Above are plots of the data - for men & for women - from newpaper obituaries in the Jan to Dec 2021 time frame.

The 'cumulative-percent' plots are more instructive than the 'raw data' plots.

The cumulative-percent plots can give an idea of the age at which 50% or 75% or 90% of deaths occur.

The cumulative-percent plots also serve to 'smooth out' the data.

For men, the 50% level looks like about age 78.

For women, the 50% level looks like about age 83.

You can see these 'cut-off' points a little more clearly by looking at the cumulative-percent data columns in the spreadsheet that was used.

Here is a link to the spreadsheet (a LibreOffice Calc '.ods' Open Document Format file) used to

  • hold the data for both men & women
  • compute the cumulative-percent data
  • make the charts (on a separate 'sheet' in the file)

Some images of the LibreOffice Calc spreadsheet columns (and the spreadsheet formulas used) may be put here someday.


    Here is a link to a '.xlsx' spreadsheet file (exported from LibreOffice Calc) and purported to be compatible with Microsoft Excel 2007-2013 XML format.

    There are no guarantees that it is readable into a current version of Microsoft Excel.

Bottom of this
Deaths-versus-Age Table -
for the 'Peninsula' - 2021

page.

To return to a previously visited web page location, click on the Back button of your web browser, a sufficient number of times.

OR, use the History-list option of your web browser.

OR ...

< Go to Top of Page, above. >

Or simply scroll up to the top of this page.


Page history:

Page was created 2022 Jan 16.

Page was changed 2022 Jan 20.
(Added to counts in the table. This concludes essentially all the data that I had collected from Sunday issues of the Daily Press newspaper.)

Page was changed 2022 Jan 21.
(A data-plots-image and a spreadsheet-link were added.)

Page was changed 2022 Feb 05.
(Added 'pre' HTML code to show the data-list better on smartphones and tablets as well as desktop and laptop computers. Added a 'data sources' section to show the Sundays from which data was collected.)